Linear & Logistic Regression


INF-604: Data Analysis

Lecturer: Dr. Sothea HAS

Outline

  • Motivation

  • Exploratory Data Analysis

  • Simple Linear Regression

  • Multiple Linear Regression

  • Logistic Regression

Motivation

Motivation

Auto-MPG Dataset (398, 9)

Code
import pandas as pd                 # Import pandas package
import numpy as np
import seaborn as sns               # Package for beautiful graphs
import matplotlib.pyplot as plt     # Graph management
sns.set(style="whitegrid")          # Set grid 
df0 = pd.read_csv(path2 + "auto-mpg.csv")   # Import it into Python
df0.head(5)                        # Randomly select 4 points
mpg cylinders displacement horsepower weight acceleration model year origin car name
0 18.0 8 307.0 130 3504 12.0 70 1 chevrolet chevelle malibu
1 15.0 8 350.0 165 3693 11.5 70 1 buick skylark 320
2 18.0 8 318.0 150 3436 11.0 70 1 plymouth satellite
3 16.0 8 304.0 150 3433 12.0 70 1 amc rebel sst
4 17.0 8 302.0 140 3449 10.5 70 1 ford torino

  • mpg: Fuel efficiency (miles per gallon).
  • cylinders: Engine cylinders count.
  • displacement: Engine size displacement (cubic inches).
  • acceleration: from 0 to 60 (mph) time (seconds).
  • origin: 1 = USA, 2 = Europe, 3 = Asia.

Motivation

Auto-MPG Dataset (398, 9)

Code
import pandas as pd                 # Import pandas package
import numpy as np
import seaborn as sns               # Package for beautiful graphs
import matplotlib.pyplot as plt     # Graph management
sns.set(style="whitegrid")          # Set grid 
data = pd.read_csv(path2 + "auto-mpg.csv")   # Import it into Python
data.head(4)                        # Randomly select 4 points
mpg cylinders displacement horsepower weight acceleration model year origin car name
0 18.0 8 307.0 130 3504 12.0 70 1 chevrolet chevelle malibu
1 15.0 8 350.0 165 3693 11.5 70 1 buick skylark 320
2 18.0 8 318.0 150 3436 11.0 70 1 plymouth satellite
3 16.0 8 304.0 150 3433 12.0 70 1 amc rebel sst

  • What affects fuel efficiency the most?
  • Are newer models more fuel-efficient?
  • What influences speed or acceleration?
  • How did MPG values change across the years (model year)?
  • How do cars differ by origin (USA, Europe, Asia)?
  • What are the characteristics of cars from different origins?

Exploratory Data Analysis (EDA)

EDA

Auto-MPG Dataset (398, 9)

Columns types

mpg cylinders displacement horsepower weight acceleration model year origin car name
0 float64 int64 float64 object int64 float64 int64 int64 object
  • Q1: Is there anything wrong with column type?
  • A1: Two main problems:
    • origin is qualitative, therefore should be “category/object”.
    • ⚠️ horsepower is quantitative, therefore should be “float/int”.
  • Modifying data type:
mpg cylinders displacement horsepower weight acceleration model year origin car name
0 float64 int64 float64 int32 int64 float64 int64 category object

⚠️ When a quantitative column is encoded as qualitative, missing values or inconsistent values may be presented.

EDA

Auto-MPG Dataset (398, 9)

Univariate analysis: Statistical summary

Code
data.describe().T.drop(columns=['count', '25%', '75%'])
df_car = data

EDA

Auto-MPG Dataset (398, 9)

Univariate analysis: Visualization

Code
quan_vars = data.select_dtypes(include="number").columns
fig, axs = plt.subplots(2, 4, figsize=(10,4.75))
for i, va in enumerate(data.columns):
    if va in quan_vars:
        sns.histplot(data, x=va, kde=True, ax=axs[i//4, i%4], stat="proportion")
    else:
        if va != "car name":
            sns.countplot(data, x=va, ax=axs[i//4, i%4], stat="proportion")
            axs[i//4, i%4].bar_label(axs[i//4, i%4].containers[0], fmt="%.2f")
plt.tight_layout()
plt.show()

Bivariate analysis: Correlation matrix

Code
pair_grid = sns.PairGrid(data=data[quan_vars], height=0.9, aspect=2)

# Map plots to the lower triangle only
pair_grid.map_lower(sns.scatterplot)  # Scatterplots in the lower triangle
pair_grid.map_diag(sns.histplot)      # Histograms on the diagonal

# pair_plot = sns.pairplot(data=data[quan_vars], height=0.9, aspect=2.5)
def corr_func(x, y, **kws): 
    r1 = np.corrcoef(x, y)[0, 1]
    plt.gca().annotate(f"{r1:.2f}", xy=(0.5, 0.5), 
                       xycoords='axes fraction', 
                       ha='center', fontsize=30, color='#1d69d1')

pair_grid.map_upper(corr_func)
for ax in pair_grid.axes[:, 0]:  # Access the first column of axes (y-axis labels)
    ax.set_ylabel(ax.get_ylabel(), rotation=45, labelpad=20)
plt.tight_layout()
plt.show()

Bivariate analysis: Visualization

  • Does fuel-efficiency depend on the origin?
Code
_, axs = plt.subplots(1, 1, figsize=(8, 5))
sns.boxplot(data=data, x="origin", y="mpg", hue="origin", ax=axs)
plt.tight_layout()
plt.show()

EDA

Summary

  • Weight shows the strongest negative correlation with mpg, followed by displacement, cylinders, and horsepower. These variables are significant in explaining variations in mpg.

  • These features are also highly correlated with each other, suggesting potential redundancy when included together in a predictive model.

  • Despite being a categorical variable, origin proves to be valuable for predicting mpg.

Simple Linear Regression (SLR)

Simple Linear Regression (SLR)

mpg vs weight

Code
data[['mpg', 'weight']].head(3)
mpg weight
0 18.0 3504
1 15.0 3693
2 18.0 3436
Code
import plotly.express as px
fig = px.scatter(data, x="weight", y="mpg", hover_name="car name")
fig.update_layout(title="mpg vs weight", height=290, width=450)
fig.show()
  • Simple Linear Model: \[\text{(prediction)}:\quad\widehat{\text{mpg}}_i=\color{blue}{a}\text{weight}_i+\color{blue}{b},\] for some \(\color{blue}{a},\color{blue}{b}\in\mathbb{R}\) to be chosen so that \(\color{red}{\widehat{\text{mpg}}_i\approx \text{mpg}_i}\) for all \(i=1,...,n.\)
  • In general, \(\hat{y}_i=\color{blue}{a}\text{x}_i+\color{blue}{b}\), with keys \(\color{blue}{a},\color{blue}{b}\), and observed data \((y_i,\text{x}_i),i=1,...,n\).

  • Objective Find the best \(\color{blue}{a}\) and \(\color{blue}{b}\) so that (prediction) \(\color{red}{\hat{y}_i\approx y_i}\) (reality) for all \(i\).

  • What does \(\color{red}{\hat{y}_i\approx y_i}\) mean?

Simple Linear Regression (SLR)

mpg vs weight

Code
data[['mpg', 'weight']].head(3)
mpg weight
0 18.0 3504
1 15.0 3693
2 18.0 3436
Code
fig.update_layout(title="Mpg vs weight", height=290, width=450)
fig.show()
  • What does \(\color{red}{\hat{y}_i\approx y_i}\) mean?
  • Q2: For \(y_0=20.312\), which one is the best prediction among: \(\color{red}{\hat{y}_0=18.2, 21.5}\) and \(\color{red}{19.73}\)?
  • A2: Consider the residuals:
\(\color{red}{\hat{y}_0}\) \(\color{red}{18.2}\) \(\color{red}{21.5}\) \(\color{blue}{19.73}\)
\(\color{red}{e_0=y_0-\hat{y}_0}\) \(\color{red}{2.112}\) \(\color{red}{-1.188}\) \(\color{blue}{0.582}\)
\(\color{red}{|e_0|}\) \(\color{red}{2.112}\) \(\color{red}{1.188}\) \(\color{blue}{0.582}\)
\(\color{red}{e_0^2}\) \(\color{red}{4.46}\) \(\color{red}{1.41}\) \(\color{blue}{0.34}\)

🔑 Small residual = good prediction.

Simple Linear Regression (SLR)

mpg vs weight

Code
# Linear Regression
from sklearn.linear_model import LinearRegression
import plotly.graph_objects as go
lr = LinearRegression()
x_w, y_mpg = data[['weight']], data[['mpg']]
lr.fit(x_w, y_mpg)
a, b = lr.coef_[0][0], lr.intercept_[0]

x_w, y_mpg = data[['weight']].to_numpy(), data[['mpg']].to_numpy()
# Generate coefficients list for different line fits
coef_list = a * np.array([4, 0.5, 0.05, 2, 1.0, 0.25, 3])

x_min, x_max = np.min(x_w), np.max(x_w)
y_min, y_max = np.min(y_mpg), np.max(y_mpg)
x_fit = np.linspace(x_min * 0.8, x_max* 1.2, 2).reshape(-1, 1)

idx = 100
x_line = np.repeat(x_w[idx],2)
# Create frames for polynomial fits

frames = []
for coef in coef_list:
    y_fit = x_fit * coef + b
    y_line = np.array([y_mpg[idx][0], x_w[idx][0] * coef + b])
    y_pred = x_w.flatten() * coef + b
    rss = np.sum((y_mpg.flatten()-y_pred) ** 2)
    frames.append(go.Frame(
        data=[go.Scatter(x=x_w.flatten(), y=y_mpg.flatten(), mode='markers', name='mpg vs weight', marker=dict(size=10)),
              go.Scatter(x=x_line.flatten(), y=y_line.flatten(), mode='lines+markers', name='Residual', line=dict(color="red", dash='dash'), visible="legendonly"),
              go.Scatter(x=x_fit.flatten(), y=y_fit.flatten(), mode='lines', line=dict(color="#b6531a"),
                         name='<br>y={:.3f}x+{:.3f}<br>RSS={:.3f}'.format(np.round(coef, 3), np.round(b, 3), np.round(rss,2)))],
        name=f'{np.round(coef, 3)}'
    ))

y_line = np.array([y_mpg[idx][0], x_w[idx][0] * coef_list[0]+ b])
y_pred0 = x_w.flatten() * coef_list[0] + b
rss0 = np.sum((y_mpg.flatten()-y_pred) ** 2)

fig1 = go.Figure(
    data=[
        go.Scatter(x=x_w.flatten(), y=y_mpg.flatten(), mode='markers', name='mpg vs weight', marker=dict(size=10)),
        go.Scatter(x=x_line.flatten(), y=y_line.flatten(), mode='lines+markers', name='Residual', line=dict(color="red", dash='dash'), visible="legendonly"),
        go.Scatter(x=x_fit.flatten(), y=x_fit.flatten()* coef_list[0]+b, mode='lines', line=dict(color="#b6531a"),
                   name=f'<br>y={np.round(coef_list[0], 3)}x+{np.round(b, 3)}<br>RSS={np.round(rss0,2)}')
    ],
    layout=go.Layout(
        title="MPG vs Weight",
        xaxis=dict(title="Weight", range=[x_min*0.8, x_max*1.1]),
        yaxis=dict(title="MPG", range=[y_min*0.6, y_max*1.1]),
        updatemenus=[{
            "buttons": [
                {
                    "args": [None, {"frame": {"duration": 1000, "redraw": True}, "fromcurrent": True, "mode": "immediate"}],
                    "label": "Play",
                    "method": "animate"
                },
                {
                    "args": [[None], {"frame": {"duration": 0, "redraw": False}, "mode": "immediate"}],
                    "label": "Stop",
                    "method": "animate"
                }
            ],
            "type": "buttons",
            "showactive": False,
            "x": -0.1,
            "y": 1.25,
            "pad": {"r": 11, "t": 50}
        }],
        sliders=[{
            "active": 0,
            "currentvalue": {"prefix": "Coefficient: "},
            "pad": {"t": 50},
            "steps": [{"label": f"{np.round(coef, 3)}",
                       "method": "animate",
                       "args": [[f'{np.round(coef, 3)}'], {"frame": {"duration": 1000, "redraw": True}, "mode": "immediate", 
                       "transition": {"duration": 10}}]}
                      for coef in coef_list]
        }]
    ),
    frames=frames
)
fig1.update_layout(title="Mpg vs weight", height=480, width=500)
fig1.show()
  • Residual Sum of Squares (RSS): \[\begin{align*}\color{red}{\text{RSS}=\sum_{i=1}e_i^2}&=\color{red}{\sum_{i=1}^n(y_i-\color{blue}{\hat{y}_i})^2}\\ &=\color{red}{\sum_{i=1}^n(y_i}-\color{blue}{a}\text{x}_i-\color{blue}{b}\color{red}{)^2}.\end{align*}\]

  • Roughly, \(\color{red}{\text{RSS}}\) is sum of all the dash lines (squared).

  • Objective: Find the coefficient \((\color{blue}{a,b})\) that produces smallest \(\color{red}{\text{RSS}}\).

  • Can you spot the best fitted line 😎?

Simple Linear Regression (SLR)

mpg vs weight

Code
# Linear Regression

from plotly.subplots import make_subplots
lr = LinearRegression()

# surface of loss
sur_loss = np.array([[RSS(x_w, y_mpg, a_, b_) for a_ in a_grid] for b_ in b_grid])

fig_surf = make_subplots(rows=1, cols=2,
            specs=[[{'type': 'xy'}, {'type': 'surface'}]],
            subplot_titles=('Fitted Line', 'Loss surface as a function of (a,b)'))

y_line = np.array([y_mpg[idx][0], x_w[idx][0] * coef_list[0]+ b])
y_pred0 = x_w.flatten() * coef_list[0] + b
rss0 = np.sum((y_mpg.flatten()-y_pred0) ** 2)

fig_surf.add_trace(go.Scatter(x=x_w.flatten(), y=y_mpg.flatten(),
    mode='markers', name='mpg vs weight', marker=dict(size=10)), row=1, col=1)
fig_surf.add_trace(go.Scatter(x=x_line.flatten(), y=y_line.flatten(), 
    mode='lines+markers', name='Residual', line=dict(color="red", dash='dash'), visible="legendonly"), row=1, col=1)
fig_surf.add_trace(go.Scatter(x=x_fit.flatten(), y=x_fit.flatten()*coef_list[0]+b, 
    mode='lines', line=dict(color="#b6531a"),
    name=f'<br>y={np.round(coef_list[0], 3)}x+{np.round(b, 3)}<br>RSS={np.round(rss0,2)}'), row=1, col=1)

fig_surf.add_trace(go.Scatter3d(
    x=[coef_list[0]] * 2, 
    y=[b] * 2,
    z=[0, rss0],
    mode="markers+lines", marker=dict(color="red", size=6),
    line=dict(dash="dash", color="red"),
    name="Loss value"), row=1, col=2)

fig_surf.add_trace(go.Surface(
    x=a_grid, 
    y=b_grid,
    z=sur_loss,
    showscale=False,
    opacity=0.3,
    name="Loss surface"), row=1, col=2)

frames_loss = []
for coef in coef_list[1:]:
    y_fit = x_fit * coef + b
    y_line = np.array([y_mpg[idx][0], x_w[idx][0] * coef + b])
    y_pred = x_w.flatten() * coef + b
    rss = np.sum((y_mpg.flatten()-y_pred) ** 2)
    frames_loss.append(
        go.Frame(
            data=[
                go.Scatter(x=x_w.flatten(), y=y_mpg.flatten(), mode='markers', 
                    name='mpg vs weight', marker=dict(size=10)),
                go.Scatter(x=x_line.flatten(), y=y_line.flatten(), mode='lines+markers', 
                    name='Residual', line=dict(color="red", dash='dash'), visible="legendonly"),
                go.Scatter(x=x_fit.flatten(), y=y_fit.flatten(), mode='lines', 
                    line=dict(color="#b6531a"), name='<br>y={:.3f}x+{:.3f}<br>RSS={:.3f}'.format(np.round(coef, 3), np.round(b, 3), np.round(rss,2))),
                go.Scatter3d(
                    x=[coef] * 2, 
                    y=[b] * 2,
                    z=[0, rss],
                    mode="markers+lines", marker=dict(color="red", size=6),
                    line=dict(dash="dash", color="red"),
                    name="Loss value"),
                go.Surface(
                    x=a_grid, 
                    y=b_grid,
                    z=sur_loss,
                    showscale=False,
                    opacity=0.3,
                    name='<br>y={:.3f}x+{:.3f}<br>RSS={:.3f}'.format(np.round(coef, 3), np.round(b, 3), np.round(rss,2)))],
            name=f'{np.round(coef, 3)}'))

fig_surf.update_layout(
        title="Loss function at different coefficients (a,b)",
        height=480,
        updatemenus=[{
            "buttons": [
                {
                    "args": [None, {"frame": {"duration": 1000, "redraw": True}, "fromcurrent": True, "mode": "immediate"}],
                    "label": "Play",
                    "method": "animate"
                },
                {
                    "args": [[None], {"frame": {"duration": 0, "redraw": False}, "mode": "immediate"}],
                    "label": "Stop",
                    "method": "animate"
                }
            ],
            "type": "buttons",
            "showactive": False,
            "x": -0.1,
            "y": 1.25,
            "pad": {"r": 11, "t": 50}
        }],
        sliders=[{
            "active": 0,
            "currentvalue": {"prefix": "Coefficient: "},
            "pad": {"t": 50},
            "steps": [{"label": f"{np.round(coef, 3)}",
                       "method": "animate",
                       "args": [[f'{np.round(coef, 3)}'], {"frame": {"duration": 1000, "redraw": True}, "mode": "immediate", 
                       "transition": {"duration": 10}}]}
                      for coef in coef_list[1:]]
        }]
    )
fig_surf.frames = frames_loss
fig_surf.update_xaxes(range=[x_min*0.8, x_max*1.1], title="Weight", row=1, col=1)
fig_surf.update_yaxes(range=[y_min*0.6, y_max*1.1], title="MPG", row=1, col=1)
fig_surf.update_scenes(
    xaxis_range=[np.min(a_grid), np.max(a_grid)],
    yaxis_range=[np.min(b_grid), np.max(b_grid)],
    zaxis_range=[0, rss0],
    # camera_eye=dict(x=1.5, y=1.5, z=1),
    # aspectmode='cube',
    row=1, col=2  # This references the first scene
)

fig_surf.show()

Simple Linear Regression (SLR)

mpg vs weight

Code
# Linear Regression
fig1.update_layout(title="Mpg vs weight", height=480, width=500)
fig1.show()

Optimal Least-Square Line

  • The best fitted line: \(\hat{y}_i=\color{blue}{\hat{a}}\text{x}_i+\color{blue}{\hat{b}}\) where

\[\begin{align} \hat{\color{blue}{a}}&=\frac{\sum_{i=1}^n(\text{x}_i-\overline{\text{x}}_n)(y_i-\overline{y}_n)}{\sum_{i=1}^n(\text{x}_i-\overline{\text{x}}_n)^2}=\frac{\text{Cov}(X,Y)}{\text{V}(X)}\\ \hat{\color{blue}{b}}&=\overline{y}_n-\hat{\color{blue}{a}}\overline{\text{x}}_n,\quad\text{with}\end{align} \]

  • \(\overline{\text{x}}_n=\frac{1}{n}\sum_{i=1}^n\text{x}_i\) and \(\overline{y}_n=\frac{1}{n}\sum_{i=1}^ny_i\): the average/mean of \(X\) and \(Y\) respectively.
  • \(\text{Cov}(X,Y)=\frac{1}{n}\sum_{i=1}^n(\text{x}_i-\overline{\text{x}}_n)(y_i-\overline{y}_n)\): the “covariance” between \(X\) & \(Y\).
  • \(\text{V}(X)=\frac{1}{n}\sum_{i=1}^n(\text{x}_i-\overline{\text{x}}_n)^2\): the “variance” of \(X\).
  • Our example: \((\color{blue}{\hat{a}},\color{blue}{\hat{b}})=\) (-0.01, 46.22).
  • Interpret: If weight increases 1 unit, mpg decreases by around \(0.01\) unit.

Simple Linear Regression (SLR)

Model Diagnostics (judging the model)

R-squared (coefficient of determination)

\[R^2=1-\frac{\text{RSS}}{\text{TSS}}=1-\frac{\sum_{i=1}(y_i-\hat{y}_i)^2}{\sum_{i=1}(y_i-\overline{y}_n)^2}=\frac{\color{red}{\text{V}(\hat{Y})}}{\color{blue}{\text{V}(Y)}}.\]

Simple Linear Regression (SLR)

Model Diagnostics (judging the model)

R-squared (coefficient of determination)

\[R^2=1-\frac{\text{RSS}}{\text{TSS}}=1-\frac{\sum_{i=1}(y_i-\hat{y}_i)^2}{\sum_{i=1}(y_i-\overline{y}_n)^2}=\frac{\color{red}{\text{V}(\hat{Y})}}{\color{blue}{\text{V}(Y)}}.\]

  • We always have \(0\leq R^2\leq 1\).
  • Example: For mpg vs weight: \(R^2=\) 0.693.
  • Interpretation: The model (weight) can explain around 69.3% of the variation of the target (mpg).

Simple Linear Regression (SLR)

Model Diagnostics (judging the model)

Residual Analysis

  • Residuals: If \(\color{red}{e_i=y_i-\hat{y}_i}\sim{\cal N}(0,\sigma^2)\) for some \(\sigma>0\) .i.e.,
    Symmetric around \(0\) & DO NOT DEPEND ON \(\text{x}_i\) nor \(y_i\).
Code
res = y_true-y_pred   # Compute residuals

from plotly.subplots import make_subplots
fig_res = make_subplots(rows=1, cols=2, 
    subplot_titles=("Residuals vs predicted mpg", 
                    "Residual desity"))
fig_res.add_trace(
    go.Scatter(x=y_pred.flatten(), y=res.flatten(), name="Residuals", mode="markers"), 
    row=1, col=1)
fig_res.add_trace(
    go.Scatter(x=[np.min(y_pred.flatten()), np.max(y_pred.flatten())], 
    y=[0,0], mode="lines", line=dict(color='red', dash="dash"), name="0"), 
    row=1, col=1)

fig_res.update_xaxes(title_text="Predicted MPG", row=1, col=1)
fig_res.update_yaxes(title_text="Residuals", row=1, col=1)


fig_res.add_trace(
    go.Histogram(x=res, name = "Residual histogram"), row=1, col=2
)
fig_res.update_xaxes(title_text="Residual", row=1, col=2)
fig_res.update_yaxes(title_text="Histogram", row=1, col=2)

fig_res.update_layout(width=950, height=300)
fig_res.show()

Simple Linear Regression (SLR)

T-test of Significance of Coefficient

  • The estimated coefficient \(\color{blue}{\hat{a}}\) and \(\color{blue}{\hat{b}}\) are computed based on a sample of data.
  • How can we be sure that the linear relation between \(\text{x}\) and \(y\) truely exists: \(\hat{y}=\color{blue}{\hat{a}}\text{x}+\color{blue}{\hat{b}}\) with \(a\neq 0\)?
  • This is equivalent to testing \(H_0: \color{blue}{\hat{a}}=0\) against \(H_1: \color{blue}{\hat{a}}\neq 0\).
  • If \(n\) is large enough (\(n>30\)) or the residual is gaussian then if \(H_0\) is true, we have \(\color{blue}{t}=\frac{\color{blue}{\hat{a}}}{s_{\color{blue}{\hat{a}}}}\sim{\cal T}(n-2)\) where \(s_{\color{blue}{\hat{a}}}\) is the standard deviation of \(\color{blue}{\hat{a}}\).
  • Given \(0\leq\color{red}{\alpha}\leq 1\), let \(\color{red}{t_{\alpha/2}}\) be the \(\color{red}{\alpha}\)-quantile of t-distribution \(\mathbb{P}(|{\cal T}(n-2)|\geq \color{red}{t_{\alpha/2}})=\color{red}{\alpha}\):
    • We can reject \(H_0\) if \(\color{blue}{t}\geq \color{red}{t_{\alpha/2}}\) (linear relation between \(\text{x}\) & \(y\) truely exists) at confidence level \(1-\color{red}{\alpha}\).
    • Else, we cannot reject \(H_0\) (not enough evidence to support a linear relationship between \(y\) & \(\text{x}\)).

Simple Linear Regression (SLR)

\(t\)-test for Coefficient

import statsmodels.api as sm
model = sm.OLS(data['mpg'], sm.add_constant(data[['weight']]))
results = model.fit()
print(results.summary())
                            OLS Regression Results                            
==============================================================================
Dep. Variable:                    mpg   R-squared:                       0.693
Model:                            OLS   Adj. R-squared:                  0.692
Method:                 Least Squares   F-statistic:                     878.8
Date:                Mon, 21 Apr 2025   Prob (F-statistic):          6.02e-102
Time:                        10:23:01   Log-Likelihood:                -1130.0
No. Observations:                 392   AIC:                             2264.
Df Residuals:                     390   BIC:                             2272.
Df Model:                           1                                         
Covariance Type:            nonrobust                                         
==============================================================================
                 coef    std err          t      P>|t|      [0.025      0.975]
------------------------------------------------------------------------------
const         46.2165      0.799     57.867      0.000      44.646      47.787
weight        -0.0076      0.000    -29.645      0.000      -0.008      -0.007
==============================================================================
Omnibus:                       41.682   Durbin-Watson:                   0.808
Prob(Omnibus):                  0.000   Jarque-Bera (JB):               60.039
Skew:                           0.727   Prob(JB):                     9.18e-14
Kurtosis:                       4.251   Cond. No.                     1.13e+04
==============================================================================

Notes:
[1] Standard Errors assume that the covariance matrix of the errors is correctly specified.
[2] The condition number is large, 1.13e+04. This might indicate that there are
strong multicollinearity or other numerical problems.

Simple Linear Regression (SLR)

Summary

  • Obtained model: mpg = -0.008\(\times\)weight + 46.217.
  • As we already rejected \(H_0:\color{blue}{\hat{a}}=0\), the coefficient \(\color{blue}{\hat{a}}=\) -0.008 can be interpreted as follows: mpg is expected to decrease (or increase) by 0.008 units for every \(1\) unit increase (or increase) in car weight.
  • R-squared: Represents the proportion of the target’s variation (mpg) captured by the model or explanatory variable weight alone.
  • Residual: In a good model, the residuals should behave like random noise, indicating that the model has captured most of the information/pattern from the target.
  • Our example:
    • The weight of cars alone can explain \(\approx 70\)% (R-squared) of the variation of mpg.
    • However, the residuals still contain patterns (large errors at large predicted mpg), suggesting the model can be improved.

Multiple Linear Regression (MLR)

Multiple Linear Regression (MLR)

mpg vs cylinders + year

  • Multiple Linear Regression: using more than 1 input, for example: \[\begin{align*}\widehat{\text{mpg}}_i&=\color{blue}{\beta_0} + \color{blue}{\beta_1}\text{acc}_i+\color{blue}{\beta_2}\text{year}_i\\(\text{Maths:}\quad \hat{y}_i&=\color{blue}{\beta_0} + \color{blue}{\beta_1}\text{x}_{i1}+\color{blue}{\beta_2}\text{x}_{i2}),\end{align*}\] with \(\color{blue}{\beta_0,\beta_1,\beta_2}\in\mathbb{R}\) to be estimated.
  • We find \([\color{blue}{\hat{\beta}_0,\hat{\beta}_1,\hat{\beta}_2}]\) minimizing \[\begin{align*}\color{red}{\text{RSS}}&=\sum_{i=1}^n(y_i-\color{blue}{\hat{y}_i})^2\\ &=\sum_{i=1}^n(y_i-\color{blue}{\beta_0}-\color{blue}{\beta_1}\text{x}_{i1}-\color{blue}{\beta_2}\text{x}_{i2})^2.\end{align*}\]
mpg cylinders model year
0 18.0 8 70
1 15.0 8 70
2 18.0 8 70

Multiple Linear Regression (MLR)

mpg vs cylinders + year

  • We find \([\color{blue}{\hat{\beta}_0,\hat{\beta}_1,\hat{\beta}_2}]\) minimizing \[\begin{align*}\color{red}{\text{RSS}}&=\sum_{i=1}^n(y_i-\color{blue}{\hat{y}_i})^2\\ &=\sum_{i=1}^n(y_i-\color{blue}{\beta_0}-\color{blue}{\beta_1}\text{x}_{i1}-\color{blue}{\beta_2}\text{x}_{i2})^2\\ &=\|\underbrace{Y}_{\begin{bmatrix}y_1\\ \vdots\\ y_n\end{bmatrix}}-\underbrace{X}_{\begin{bmatrix}1 & \text{x}_{11} &\text{x}_{12}\\ \vdots & \vdots & \vdots\\ 1 & \text{x}_{n1} &\text{x}_{n2}\end{bmatrix}}\color{blue}{\underbrace{\vec{\beta}}_{\begin{bmatrix}\beta_0\\ \beta_1\\ \beta_2\end{bmatrix}}}\|^2.\end{align*}\]
  • Minimizing \(\color{red}{\text{RSS}}\Rightarrow \color{blue}{\vec{\beta}^*=(X^TX)^{-1}X^TY}.\)
  • Prediction: \(\color{blue}{\hat{Y}}=X\color{blue}{\vec{\beta}^*}\).
mpg cylinders model year
0 18.0 8 70
1 15.0 8 70
2 18.0 8 70

Multiple Linear Regreesion (MLR)

Model Diagnostics

Adjusted R-squared

  • Normally, \(R^2\) increases along with the number of inputs, but a good model may not need so many variables.
  • A better criterion, Adjusted R-squared (balancing the number of inputs with the increment in \(R^2\)): \[R^2_{\text{adj}}=1-\frac{n-1}{n-d-1}(1-R^2).\] Here, \(n\) is the number of observations, \(d\) is the number of inputs.
  • Usually, \(R^2_{\text{adj}}\leq R^2\).
  • For our model: \(R^2=\) 0.715 and \(R^2_{\text{adj}}=\) 0.714 (this is a good sign!).
  • A large \(R^2\) with a slight drop in \(R^2_{\text{adj}}\) indicates a good MLR model.

Multiple Linear Regreesion (MLR)

Model Diagnostics (cont.)

Residual analysis

Code
resid = y_train - y_hat   # residuals

from plotly.subplots import make_subplots

fig_res = make_subplots(rows=1, cols=2, subplot_titles=("Residuals vs predicted sales", "Residual desity"))

fig_res.add_trace(
    go.Scatter(x=y_hat, y=resid, name="Residuals", mode="markers"), 
    row=1, col=1)
fig_res.add_trace(
    go.Scatter(x=[np.min(y_hat), np.max(y_hat)], y=[0,0], mode="lines", line=dict(color='red', dash="dash"), name="0"), 
    row=1, col=1)

fig_res.update_xaxes(title_text="Predicted Sales", row=1, col=1)
fig_res.update_yaxes(title_text="Residuals", row=1, col=1)


fig_res.add_trace(
    go.Histogram(x=resid, name = "Residual histogram"), row=1, col=2
)
fig_res.update_xaxes(title_text="Residual", row=1, col=2)
fig_res.update_yaxes(title_text="Histogram", row=1, col=2)

fig_res.update_layout(width=950, height=350)
fig_res.show()

Multiple Linear Regression (MLR)

\(t\)-test of coefficients

  • Just like in SLR, we can test \(H_0: \beta_j=0\) against \(H_1:\beta_j\neq 0\) using \(t\)-test.
  • If one of the two assumptions is true:
    • There are large enough observations \(n>30\)
    • Or the residuals follow Gaussian distribution with constant variance, then \(H_0\) is true, \[t_j=\frac{\beta_j}{s_{j}}\sim {\cal T}(n-d-1).\]
  • For a given level \(\alpha\), we CAN REJECT \(H_0:\beta_j=0\) if \(|t_j|>t_{\alpha/2}\).

Multiple Linear Regression (MLR)

\(t\)-test of coefficients

import statsmodels.api as sm
model = sm.OLS(df['mpg'], sm.add_constant(df[['cylinders', 'year']]))
results = model.fit()
print(results.summary())
                            OLS Regression Results                            
==============================================================================
Dep. Variable:                    mpg   R-squared:                       0.715
Model:                            OLS   Adj. R-squared:                  0.714
Method:                 Least Squares   F-statistic:                     488.1
Date:                Mon, 21 Apr 2025   Prob (F-statistic):          8.84e-107
Time:                        10:23:02   Log-Likelihood:                -1115.1
No. Observations:                 392   AIC:                             2236.
Df Residuals:                     389   BIC:                             2248.
Df Model:                           2                                         
Covariance Type:            nonrobust                                         
==============================================================================
                 coef    std err          t      P>|t|      [0.025      0.975]
------------------------------------------------------------------------------
const        -17.1464      4.944     -3.468      0.001     -26.866      -7.426
cylinders     -2.9981      0.132    -22.718      0.000      -3.258      -2.739
year           0.7502      0.061     12.276      0.000       0.630       0.870
==============================================================================
Omnibus:                       24.502   Durbin-Watson:                   1.290
Prob(Omnibus):                  0.000   Jarque-Bera (JB):               31.620
Skew:                           0.513   Prob(JB):                     1.36e-07
Kurtosis:                       3.940   Cond. No.                     1.79e+03
==============================================================================

Notes:
[1] Standard Errors assume that the covariance matrix of the errors is correctly specified.
[2] The condition number is large, 1.79e+03. This might indicate that there are
strong multicollinearity or other numerical problems.

Multiple Linear Regression (MLR)

Summary

  • Obtained model: MPG = -17.146 -2.998 cylinders + 0.75 year.
  • Rough interpretion, \(\beta_1=\) -2.998 indicates that if cylinders increase (or decreases) by \(1\) unit, mpg is expected to decrease (or increase) by 2.998 units.
  • Explain: \(\beta_2=\) 0.75.
  • \(R^2=\) 0.715 indicates that around 71.5% variation of mpg can be explained by cylinders and year together, which is better than weight alone.
  • A slight decrease in \(R^2_{\text{adj}}=\) 0.714 suggests that the information provided by both variables is not redundant for explaining mpg.
  • The spread values of residuals around large predicted mpg indicates that the model underestimates the actual target.

Logistic Regression (LR)

Logistic Regression (LR)

  • Linear Regression aims at predicting quantitative target. Such a problem is called Regression Problem.
  • Logistic Regression aims at predicting categorical target. It’s a Classification method.
  • Consider our survey available here: Data Collection.
neck (cm) waist (cm) height (m) weight (kg)
count 11.00000 11.000000 11.000000 11.000000
mean 33.90000 75.663636 48.140000 60.227273
std 8.20317 23.492010 79.691223 12.098272
min 13.50000 27.000000 1.580000 49.000000
25% 32.00000 66.500000 1.650000 49.500000
50% 36.00000 73.000000 1.740000 58.000000
75% 38.60000 81.000000 80.910000 71.000000
max 44.70000 115.300000 180.000000 83.000000
  • What’s wrong with this data?

Logistic Regression (LR)

Bivariate analysis

neck (cm) waist (cm) height (m) weight (kg)
neck (cm) 1.000000 0.883607 0.541476 0.762261
waist (cm) 0.883607 1.000000 0.307691 0.795352
height (m) 0.541476 0.307691 1.000000 0.597656
weight (kg) 0.762261 0.795352 0.597656 1.000000
  • It’s clear that neck is linearly related with waist size.
  • It’s weight is linearly related with both neck and waist.
  • Q1: What columns would you use to predict gender?
  • A1: Height & weight as they separate gender well.
  • Logistic Regression is for predicting qualitative variables.

Logistic Regression (LR)

Binary Logistic Regression

x1 x2 y
-0.752759 2.704286 1
1.935603 -0.838856 0
Code
import plotly.express as px
import plotly.graph_objects as go
fig = px.scatter(
    data_toy1, x="x1", y="x2", 
    color="y")

# Lines
line_coefs = np.array(
    [[1, 1, -2], [-1, 0.3, 0.5], [-0.5, 0.3, -1], [0.1, -1, 1]])
frames = []
x_line = np.array([np.min(x1[:,1]), np.max(x1[:,1])])
y_range = np.array([np.min(x1[:,2]), np.max(x1[:,2])])
id_small = np.argsort(np.abs(x1[:,1]) + np.abs(x1[:,2]))[5]
point_far = np.array([x_line[0], y_range[1]])
point_near = np.array([x1[id_small,1],x1[id_small,2]])

for i, coef in enumerate(line_coefs):
    y_line = (-coef[0] - coef[1] * x_line) / coef[2]
    a, b = -coef[1]/coef[2], -coef[0]/coef[2]
    point_proj_far = np.array([(point_far[0]+a*point_far[1]-a*b)/(a**2+1), a*(point_far[0]+a*point_far[1]-a*b)/(a**2+1)+b])
    point_proj_near = np.array([(point_near[0]+a*point_near[1]-a*b)/(a**2+1), a*(point_near[0]+a*point_near[1]-a*b)/(a**2+1)+b])
    p1 = np.row_stack([point_far, point_proj_far])
    p2 = np.row_stack([point_near, point_proj_near])
    frames.append(go.Frame(
        data=[fig.data[0],
              fig.data[1],
              go.Scatter(
                x=p1[:,0],
                y=p1[:,1],
                name="Far from boundary",
                line=dict(dash="dash"),
                visible="legendonly"
              ),
              go.Scatter(
                x=p2[:,0],
                y=p2[:,1],
                name="Close to boundary",
                line=dict(dash="dash"),
                visible="legendonly"
              ),
              go.Scatter(
                x=x_line, y=y_line, mode='lines',
                line=dict(width=3, color="black"), 
                name=f'Line: {i+1}')],
        name=f'{i+1}'))

y_line = (-line_coefs[0,0] - line_coefs[0,1] * x_line) / line_coefs[0,2]
a, b = -line_coefs[0,0]/line_coefs[0,2], - line_coefs[0,1]/line_coefs[0,2]
point_proj_far = np.array([(point_far[0]+a*point_far[1]-a*b)/(a**2+1), a*(point_far[0]+a*point_far[1]-a*b)/(a**2+1)+b])
point_proj_near = np.array([(point_near[0]+a*point_near[1]-a*b)/(a**2+1), a*(point_near[0]+a*point_near[1]-a*b)/(a**2+1)+b])
p1 = np.row_stack([point_far, point_proj_far])
p2 = np.row_stack([point_near, point_proj_near])
fig1 = go.Figure(
    data=[
        fig.data[0],
        fig.data[1],
        go.Scatter(
            x=p1[:,0],
            y=p1[:,1],
            name="Far from boundary",
            line=dict(dash="dash"),
            visible="legendonly"
            ),
        go.Scatter(
            x=p2[:,0],
            y=p2[:,1],
            name="Close to boundary",
            line=dict(dash="dash"),
            visible="legendonly"
        ),
        go.Scatter(
            x=x_line, y=y_line, mode='lines',
            line=dict(width=3, color="black"), 
            name=f'Line: 1')
    ],
    layout=go.Layout(
        title="1st simulated data & boundary lines",
        xaxis=dict(title="x1", range=[-3.4, 3.4]),
        yaxis=dict(title="x2", range=[-3.4, 3.4]),
        updatemenus=[{
            "buttons": [
                {
                    "args": [None, {"frame": {"duration": 1000, "redraw": True}, "fromcurrent": True, "mode": "immediate"}],
                    "label": "Play",
                    "method": "animate"
                },
                {
                    "args": [[None], {"frame": {"duration": 0, "redraw": False}, "mode": "immediate"}],
                    "label": "Stop",
                    "method": "animate"
                }
            ],
            "type": "buttons",
            "showactive": False,
            "x": -0.1,
            "y": 1.25,
            "pad": {"r": 10, "t": 50}
        }],
        sliders=[{
            "active": 0,
            "currentvalue": {"prefix": "Line: "},
            "pad": {"t": 50},
            "steps": [{"label": f"{i}",
                       "method": "animate",
                       "args": [[f'{i}'], {"frame": {"duration": 1000, "redraw": True}, "mode": "immediate", 
                       "transition": {"duration": 10}}]}
                      for i in range(1,5)]
        }]
    ),
    frames=frames
)

fig1.update_layout(height=370, width=500)

fig1.show()
  • Objective: Given input \(\text{x}_i\in\mathbb{R}^d\), classify if \(y\in\{0,1\}\) (Male or female).
  • Main idea: classify \(\Leftrightarrow\) identify decision boundary.
  • Main assumption: Boundary(B) is linear.
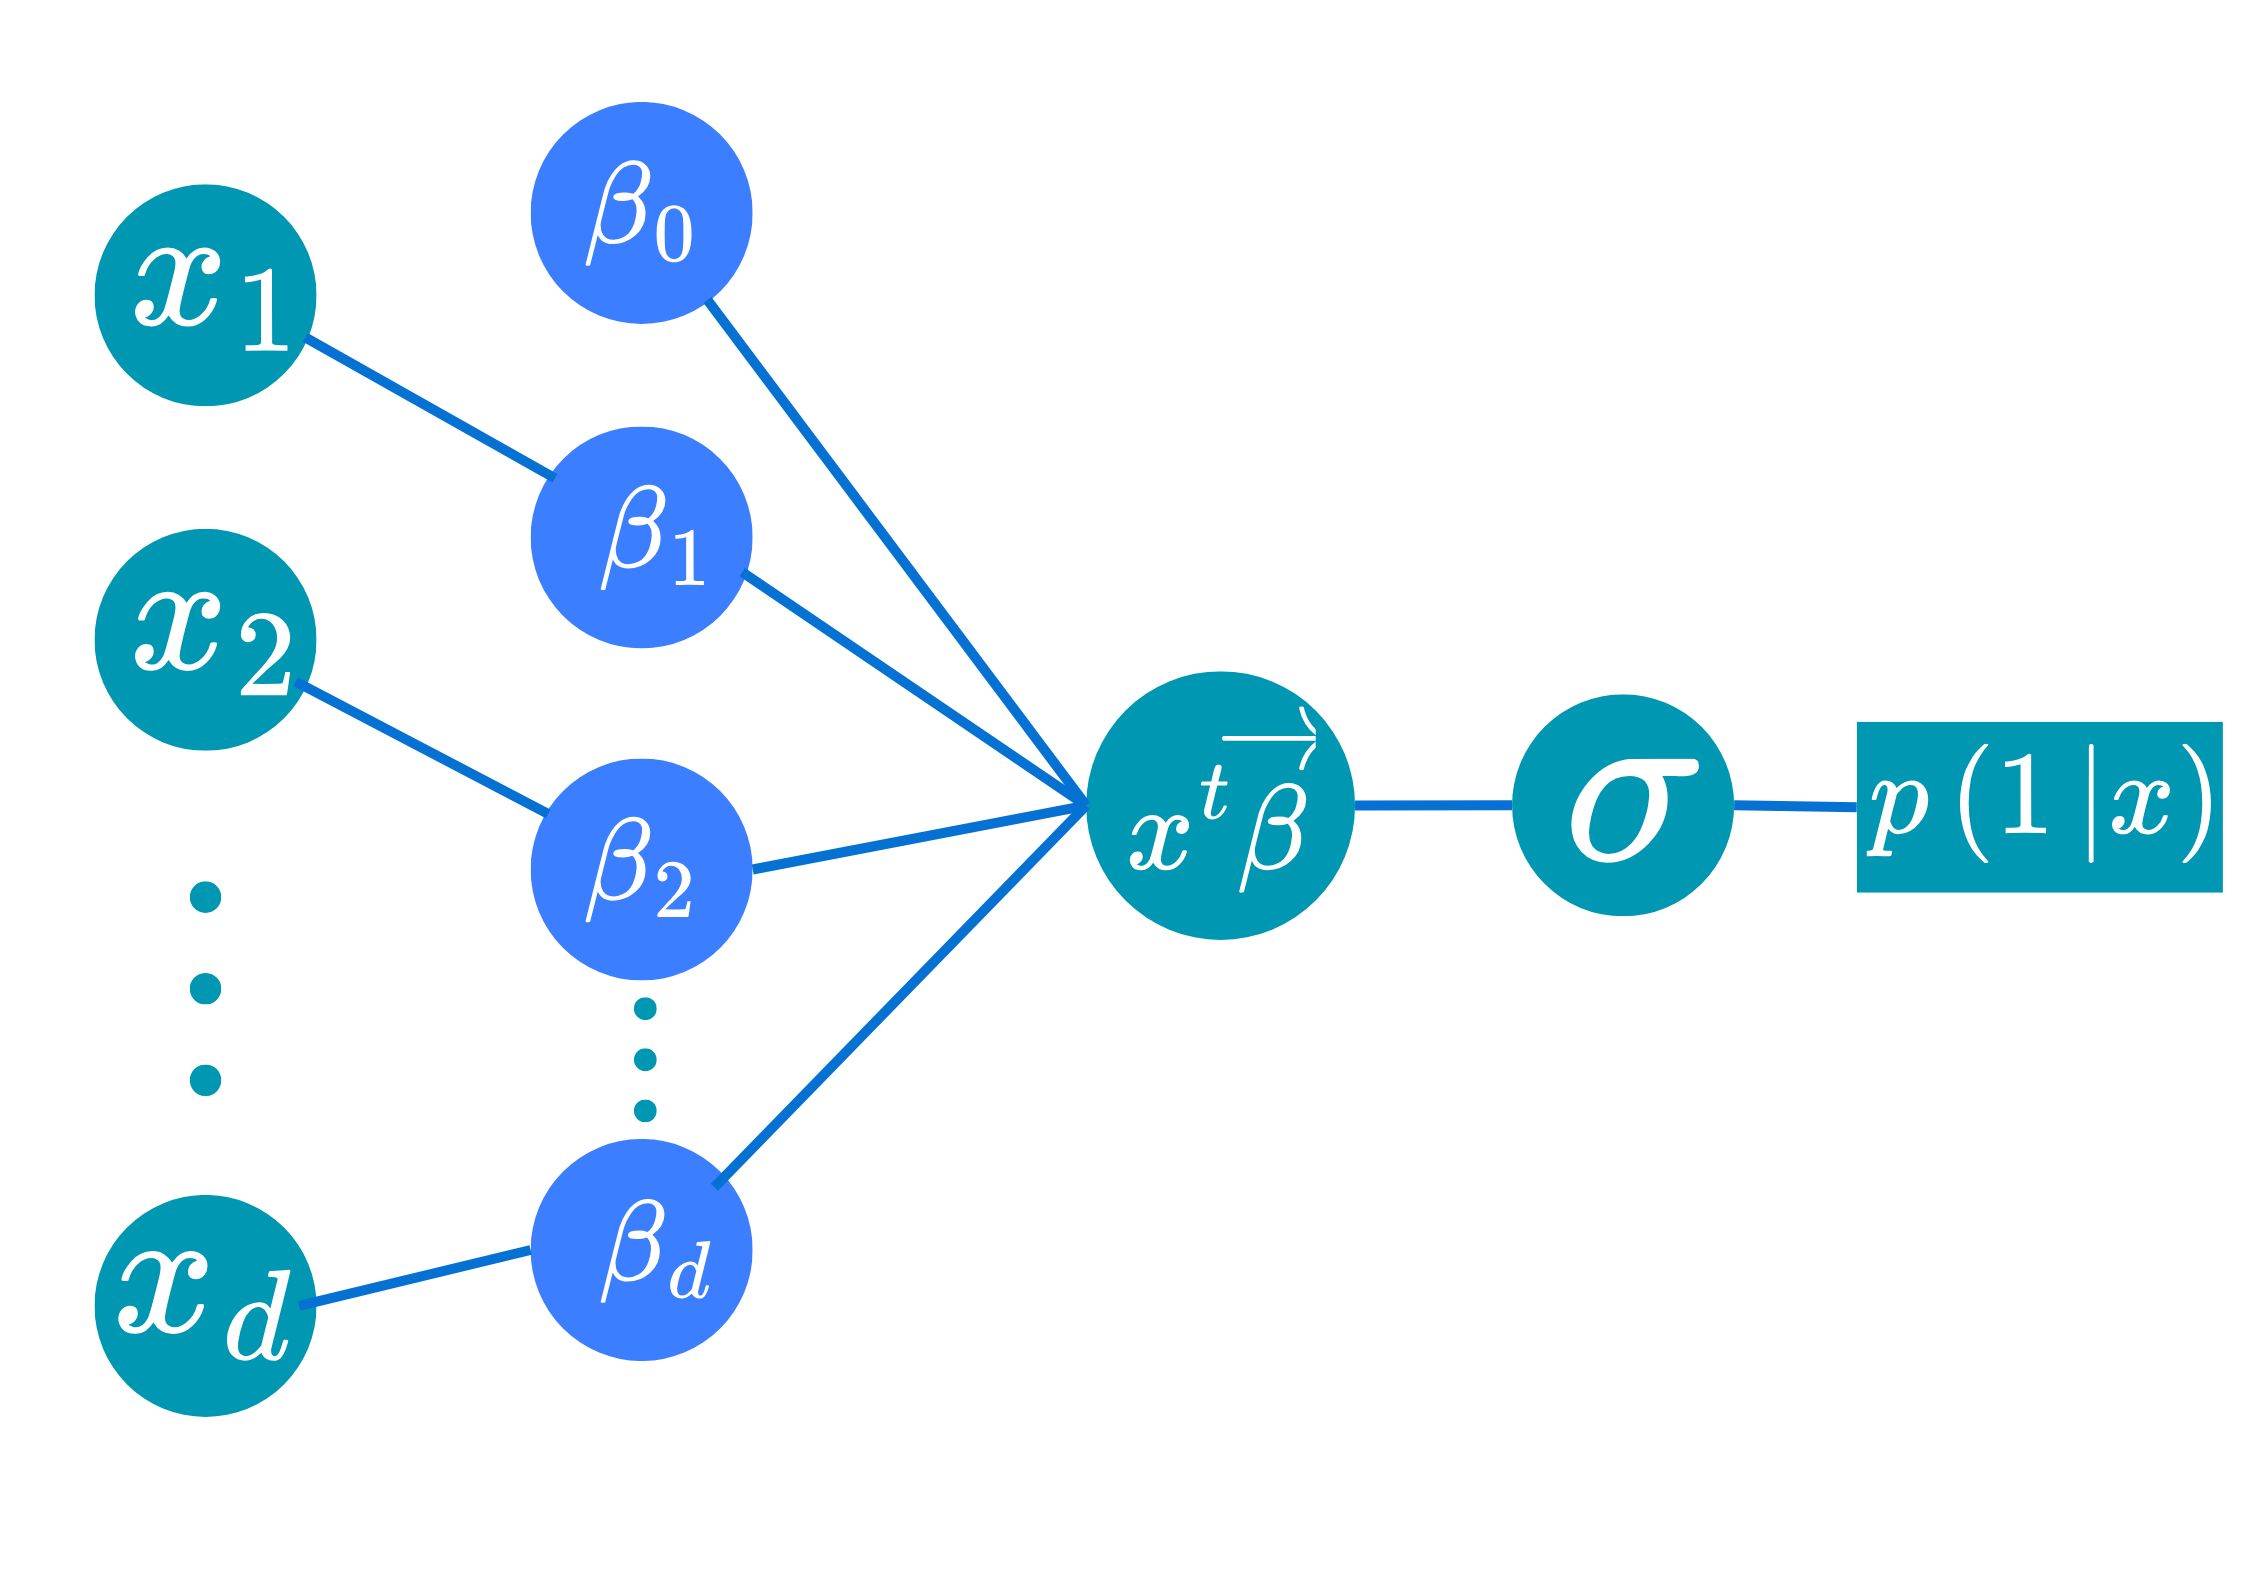
  • Model: Given input \(\text{x}_i\), the chance that it belongs to class \(1\) is given by \[\mathbb{P}(Y_i=1|X=\text{x}_i)=\sigma(\color{blue}{\beta_0}+\sum_{j=1}^d\color{blue}{\beta_j}x_{ij}),\] where \(\color{blue}{\beta_0,\beta_1,\dots,\beta_d}\in\mathbb{R}\) are the key parameters to be estiamted from the data, and \(\sigma(t)=1/(1+e^{-t}),\forall t\geq 0\).

Binary Logistic Regression

Model intuition

  • Ex: Given \(\text{x}_0=[\text{h}_0,\text{w}_0]\in\mathbb{R}^2,\) for any candidate parameter \(\color{blue}{\vec{\beta}=[\beta_0,\beta_1,\beta_2]}\), \[\color{green}{z_0}=\color{blue}{\beta_0}+\color{blue}{\beta_1}\text{h}_0+\color{blue}{\beta_2}\text{w}_0\text{ is the relative distance from }\text{x}_0\to\text{ Boundary (B)}.\]
  • That’s to say that
    • \(\color{green}{z_0}>0\Leftrightarrow \text{x}_0\) is above the boundary.
    • \(|\color{green}{z_0}|\) is large \(\Leftrightarrow\) \(\text{x}_0\) is far from the bounday.
  • A good boundary should be such that:
    • \(|\color{green}{z_0}|\) large \(\Rightarrow\) “certain about its class”.
    • \(|\color{green}{z_0}|\) small \(\Rightarrow\) “less certain about its class”.

Binary Logistic Regression

Model intuition

  • A good boundary should be such that:
    • \(|\color{green}{z_0}|\) large \(\Rightarrow\) “certain about its class”.
    • \(|\color{green}{z_0}|\) small \(\Rightarrow\) “less certain about its class”.
  • Sigmoid function, \(\sigma:\mathbb{R}\to (0,1)\)

\[\color{green}{z}\mapsto\sigma(\color{green}{z})=\frac{1}{1+\exp(-\color{green}{z})}.\]

Key ideas

  • \(\color{green}{z_0}=\color{blue}{\beta_0}+\text{x}_0^T\color{blue}{\vec{\beta}}\) is the relative distance of \(\text{x}_0\) w.r.t (B).
  • Sigmoid converts this relative distance into probability.

Binary Logistic Regression

Example

  • For \(\color{blue}{(\beta_0,\beta_1,\beta_2)=(1, 1, -2)}\), compute \(p(\color{blue}{1}|\text{x})\) for the data:
x1 x2 y
2.489186 -0.779048 0
-2.572868 -1.086146 1
2.767143 2.432104 0
  • Compute relative distance \(z_i=\color{blue}{\beta_0}+\text{x}_i^T\color{blue}{\vec{\beta}}\), then \(p(1|\text{x}_i)\) \[\begin{align*}z_1&=1+1(2.489186)-2(-0.779048)\\ &=5.047282>0\\ \Rightarrow p(1|\text{x}_1)&=\sigma(z_1)=1/(1+e^{-5.047282})=\color{blue}{0.9936}.\\ \\ z_2&=1+1(-2.572868)-2(-1.086146)\\ &=0.599424>0\\ \Rightarrow p(1|\text{x}_2)&=\sigma(z_2)=1/(1+e^{-0.599424})=\color{blue}{0.6455}.\\ \\ z_3&=1+1(2.767143)-2(2.432104)\\ &=-1.097065 < 0\\ \Rightarrow p(1|\text{x}_3)&=\sigma(z_3)=1/(1+e^{-(-1.097065)})=\color{red}{0.2503}.\end{align*}\]

  • Interpretation: \(\text{x}_1,\text{x}_2\) are located above the line \((B):1+x_1-2x_2\) as \(z_1,z_2>0\) and are predicted to be in class \(\color{blue}{1}\). On the other hand, \(\text{x}_3\) is located below the line (\(z_3<0\)) and is predicted to be in class \(\color{red}{0}\).

  • Q4: Now,how do we find the best key parameter \(\color{blue}{\beta_0,\dots,\beta_d}\)?

  • We will build a criterion just like RSS in linear regression.

Binary Logistic Regression

Conditional likelihood \(\to\) Cross-entropy

  • Data: \({\cal D}=\{(\text{x}_1,y_1),...,(\text{x}_n,y_n)\}\subset\mathbb{R}^d\times \{0,1\}\).
  • Objective: search for \(\color{blue}{\beta_0}\in\mathbb{R},\color{blue}{\vec{\beta}}\in\mathbb{R}^d\) such that the model is best aligned with the data \({\cal D}\): \[p(y_i|\text{x}_i)\text{ is large for all }i\in\{1,\dots,n\}.\]
  • Conditional Likelihood Function: If the data are iid, one has \[\begin{align*}{L}(\color{blue}{\beta_0},\color{blue}{\vec{\beta}})&=\mathbb{P}(Y_1=y_1,\dots,Y_n=y_n|X_1=\text{x}_1,\dots,X_n=\text{x}_n)\\ &=\prod_{i=1}^np(y_i|\text{x}_i)\\ &=\prod_{i=1}^n\Big[p(1|\text{x}_i)\Big]^{y_i}\Big[p(0|\text{x}_i)\Big]^{1-y_i}\\ &=\prod_{i=1}^n\Big[\sigma(-\color{blue}{\beta_0}-\text{x}_i^T\color{blue}{\vec{\beta}})\Big]^{y_i}\Big[(1-\sigma(-\color{blue}{\beta_0}-\text{x}_i^T\color{blue}{\vec{\beta}}))\Big]^{1-y_i}. \end{align*}\]

  • Cross-entropy: \(\text{CEn}(\color{blue}{\vec{\beta}})=-\sum_{i=1}^n\Big[y_i\log[\sigma(-\color{blue}{\beta_0}-\text{x}_i^T\color{blue}{\vec{\beta}})]+(1-y_i)\log[(1-\sigma(-\color{blue}{\beta_0}-\text{x}_i^T\color{blue}{\vec{\beta}}))]\Big]\).

Binary Logistic Regression

Estimating coefficients

  • We search for coefficient \(\color{blue}{\vec{\beta}}=[\color{blue}{\beta_0,\dots,\beta_d}]\) minimizing \[\text{CEn}(\color{blue}{\vec{\beta}})=-\sum_{i=1}^n\Big[y_i\log[\sigma(-\color{blue}{\beta_0}-\text{x}_i^T\color{blue}{\vec{\beta}})]+(1-y_i)\log[(1-\sigma(-\color{blue}{\beta_0}-\text{x}_i^T\color{blue}{\vec{\beta}}))]\Big].\]

  • 😭 Unfortunately, such minimizer values \((\color{blue}{\widehat{\beta}_0,\widehat{\vec{\beta}}})\) CANNOT be analytically computed.

  • 😊 Fortunately, it can be numerically approximated!

  • We can use optimization algorithms such as Gradient Descent Algorithm to estimate the best \(\color{blue}{\hat{\beta}}\).

For more on Gradient Descent Algorithm for Logistic Regression, read here.

Binary Logistic Regression

Summary

Logistic Regression Model

  • Main model: \(p(1|\text{x})=1/(1+e^{-\color{green}{z}})=1/(1+e^{-(\color{blue}{\beta_0}+\text{x}^T\color{blue}{\vec{\beta}})})\).
    • Interpretation:
      • Boundary decision is Linear defined by the coefficients \(\color{blue}{\beta_0}\) and \(\color{blue}{\vec{\beta}}\).
      • Probability of being in each class depends on the relative distance of that point to the boundary.
      • Works well when classes are linearly separable.

  • Objective: buliding a Logistic Regression model is equivalent to searching for parameters \(\color{blue}{\beta_0}\) and \(\color{blue}{\vec{\beta}}\) that minimizes the Cross-entropy.
  • The loss cannot be minimized analytically but can be minimized numerically.

Logistic Regression

Application on Auto-MPG

  • For our Auto-MPG dataset, we aim at predicting origin using some characteristics of the cars.
  • Build intuition through visualization:

Logistic Regression

Application on Auto-MPG

  • We predict origin using all quantitative columns.
from sklearn.linear_model import LogisticRegression
from sklearn.model_selection import train_test_split
# Building the model
X_train, X_test, y_train, y_test = train_test_split(
    df_car.select_dtypes(include="number"),
    df_car[['origin']])
lgit = LogisticRegression()
lgit = lgit.fit(X_train, y_train)
# Prediction
y_pred = lgit.predict(X_test)
# Accuracy
acc = np.mean(y_pred.flatten() == y_test.to_numpy().flatten())
  • Accuracy = 0.745.
  • Here, accuracy is defined by \[\text{Accuracy}=\frac{\text{Num. correctly predicted}}{\text{Num. observations}}.\]

Logistic Regression

Summary

  • We introduce basic concept of Logistic Regression Model: \[p(1|X=\text{x})=\frac{1}{(1+e^{-\color{blue}{\beta_0}-\text{x}^T\color{blue}{\vec{\beta}}})}.\]
  • The intuition of the model: the probability of being in class \(1\) depends on the relative distance from \(\text{x}\) to a linear boundary defined by \(\color{blue}{[\beta_0,\beta_1,\dots,\beta_d]}\).
  • The linear boundary assumption may be too weak in practice.
  • The performance of the model can be improved further by
    • Selecting relevant features
    • Feature engineering: polynomial transform…
    • Regularization or penalty methods…

🥳 Yeahhhh….


Let’s Party… 🥂