Course: INF-604: Data Analysis Lecturer: Sothea HAS, PhD
Objective: You have already seen some elements of Data Analysis in the course. In this lab, we will take our first step into working with the main element of Data Analysis, which is the dataset. By the end of this lab, you will be able to import data into a Jupyter Notebook and perform some data manipulation.
Imagine you want to start your own business, such as a coffee shop or a bookstore. What types of data do you think you need to gather to determine the potential success of your business? Here are some questions to help you think and answer this question:
What is your plan for the business?
What information might you need to collect? What is the size of the data?
Where do you think you can find this information?
What might go wrong with the collected data?
We handle such problems in what step of Data Analysis process?
Answer:
2. Importing Some Data
There are many online data sources that you can explore, and one of the most popular is Kaggle. In addition to datasets, Kaggle also hosts data competitions with prizes and offers courses to help you advance in data learning.
Here, we start our journey by exploring a dataset that you probably have heard its name before: Titanic. You can download it from Kaggle using the following codes.
# %pip install kagglehubimport kagglehub# Download latest versionpath = kagglehub.dataset_download("yasserh/titanic-dataset")# Pandas module allows you to import the dataimport pandas as pddata = pd.read_csv(path+'/Titanic-Dataset.csv')data.head(10)
Warning: Looks like you're using an outdated `kagglehub` version (installed: 0.3.7), please consider upgrading to the latest version (0.3.10).
PassengerId
Survived
Pclass
Name
Sex
Age
SibSp
Parch
Ticket
Fare
Cabin
Embarked
0
1
0
3
Braund, Mr. Owen Harris
male
22.0
1
0
A/5 21171
7.2500
NaN
S
1
2
1
1
Cumings, Mrs. John Bradley (Florence Briggs Th...
female
38.0
1
0
PC 17599
71.2833
C85
C
2
3
1
3
Heikkinen, Miss. Laina
female
26.0
0
0
STON/O2. 3101282
7.9250
NaN
S
3
4
1
1
Futrelle, Mrs. Jacques Heath (Lily May Peel)
female
35.0
1
0
113803
53.1000
C123
S
4
5
0
3
Allen, Mr. William Henry
male
35.0
0
0
373450
8.0500
NaN
S
5
6
0
3
Moran, Mr. James
male
NaN
0
0
330877
8.4583
NaN
Q
6
7
0
1
McCarthy, Mr. Timothy J
male
54.0
0
0
17463
51.8625
E46
S
7
8
0
3
Palsson, Master. Gosta Leonard
male
2.0
3
1
349909
21.0750
NaN
S
8
9
1
3
Johnson, Mrs. Oscar W (Elisabeth Vilhelmina Berg)
female
27.0
0
2
347742
11.1333
NaN
S
9
10
1
2
Nasser, Mrs. Nicholas (Adele Achem)
female
14.0
1
0
237736
30.0708
NaN
C
2.1. Overview of the data
Answer the following questions:
A. How many rows and columns are there in this dataset?
B. Explain the meaning of each column.
C. Are there any missing values in this dataset? If so, how many rows contain at least one missing value?
What should you do with column Cabin?
How would you drop rows with at least one missing value?
Answer:
A. Dimension of the data
data.shape # 'shape' will return the number of rows and columns
(891, 12)
B. Description: The description of the each column can be found in Kaggle Titanic Dataset available here.
C. Yes! The percentage of missing values within each column is presented below.
data.isna().sum().to_frame().T/data.shape[0] *100
PassengerId
Survived
Pclass
Name
Sex
Age
SibSp
Parch
Ticket
Fare
Cabin
Embarked
0
0.0
0.0
0.0
0.0
0.0
19.86532
0.0
0.0
0.0
0.0
77.104377
0.224467
Since column Cabin contains nearly 80% missing values, it is not helpful for our analysis, therefore we simply drop this column. This can be done as follows:
Since ‘Age’ and ‘Embarked’ contains less than 30% missing values, handling these missing values may require more consideration, and we will see that later in this course. For now, we simply drops the rows with at least one missing value.
data_NoNA = data_NoNA.dropna() # drop row with missing values/NaN then save it as data_NoNAdata_NoNA.isna().sum().to_frame().T # Check it again
Survived
Pclass
Name
Sex
Age
SibSp
Parch
Ticket
Fare
Embarked
0
0
0
0
0
0
0
0
0
0
0
2.2. Single information
D. How many male and female passengers were on the ship?
data['Sex'].value_counts() # value_counts() it will count unique values within the data that is is applied to
count
Sex
male
577
female
314
E. How many of them survived? How many didn’t?
data['Survived'].value_counts()
count
Survived
0
549
1
342
F. How many passengers were younger than 3 years old? How many were older than 60 years old?
sum(data['Age'] <3)
24
sum(data['Age'] >60)
22
G. How many passengers embarked from the three ports?
C: Cherbourg, France.
Q: Queentown, Ireland.
S: Southampton, England.
data['Embarked'].value_counts()
count
Embarked
S
644
C
168
Q
77
H. How many passengers were in the 1st, 2nd and 3rd class?
data['Pclass'].value_counts()
count
Pclass
3
491
1
216
2
184
2.3. Multiple information
I. How many 1st class passengers survived? How about 2nd and 3rd class?
According to this table, - Among 1st class passengers, 136 survived and 80 did not. - Within 2nd class, 87 surived and 97 did not. - Lastly, only 119 of 3rd class passengers surived while 372 did not.
J. How many female passengers survived? How many males did?
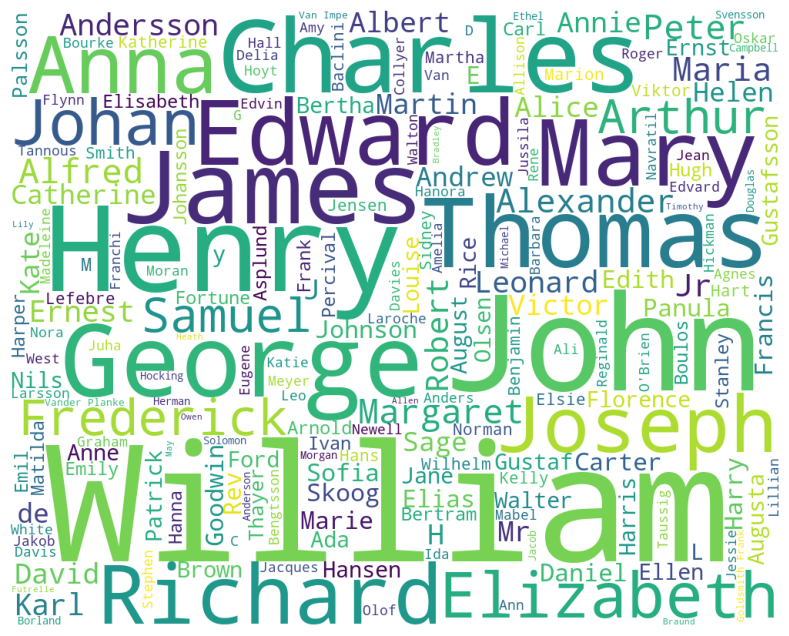
We can create a word cloud highlighting the names of passengers.
import matplotlib.pyplot as pltfrom wordcloud import WordCloud# Here I process the names by removing repeated words other than the namesnames =' '.join(data.Name.values)words = names.replace(',', '')\ .replace('Mr.', '')\ .replace('Mrs.', '')\ .replace('Miss.', '')\ .replace('Master.', '')\ .replace('Dr.', '')# Create the cloudwc = WordCloud(width=1000, height=800, background_color='white').generate(words)plt.figure(figsize=(12, 8))plt.imshow(wc)plt.axis('off')plt.show()