Code
import pandas as pd # Import pandas package
import seaborn as sns # Package for beautiful graphs
import matplotlib.pyplot as plt # Graph management
sns.set(style="whitegrid") # Set grid background
# path = "https://gist.githubusercontent.com/curran/4b59d1046d9e66f2787780ad51a1cd87/raw/9ec906b78a98cf300947a37b56cfe70d01183200/data.tsv" # The data can be found in this link
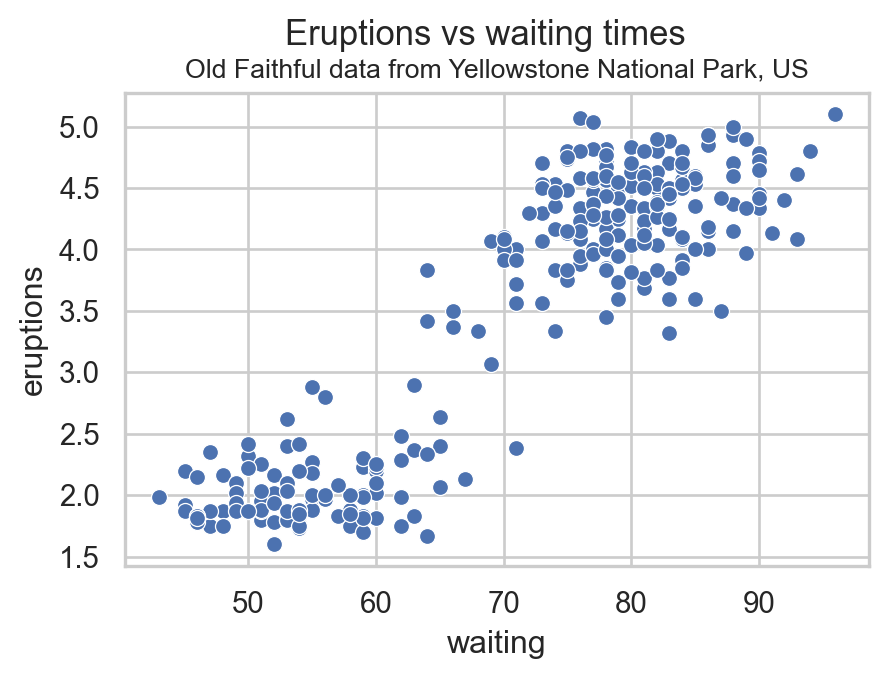
df0 = pd.read_csv(path0 + "/faithful.csv" ) # Import it into Python
df0.head(5) # Randomly select 4 points| eruptions | waiting | |
|---|---|---|
| 0 | 3.600 | 79 |
| 1 | 1.800 | 54 |
| 2 | 3.333 | 74 |
| 3 | 2.283 | 62 |
| 4 | 4.533 | 85 |