| Order_ID | Distance_km | Weather | Traffic_Level | Time_of_Day | Vehicle_Type | Preparation_Time_min | Courier_Experience_yrs | Delivery_Time_min | |
|---|---|---|---|---|---|---|---|---|---|
| 0 | 522 | 7.93 | Windy | Low | Afternoon | Scooter | 12 | 1.0 | 43 |
| 1 | 738 | 16.42 | Clear | Medium | Evening | Bike | 20 | 2.0 | 84 |
| 2 | 741 | 9.52 | Foggy | Low | Night | Scooter | 28 | 1.0 | 59 |
| 3 | 661 | 7.44 | Rainy | Medium | Afternoon | Scooter | 5 | 1.0 | 37 |
| 4 | 412 | 19.03 | Clear | Low | Morning | Bike | 16 | 5.0 | 68 |
Lab3: Data Quality & Preprocessing
Course: INF-604: Data Analysis
Lecturer: Sothea HAS, PhD
Objective: In this lab, you will delve deeper into assessing the quality of datasets and employing preprocessing techniques to properly clean them.
- You can work directly with
Google Colabhere: Lab3_Preprocessing.ipynb.
1. Food Delivery Dataset
Let’s consider Delivery dataset discussed in the previous Lab2. Read and load the data from kaggle: Food Delivery Dataset.
A. Overview:
Drop the column
Order_ID. What’s the dimension of this dataset?Compute statistical summary to briefly understand each individual column.
Visualize the distribution of each column and describe the graph briefly.
Address the problems related to the quality of this dataset.
# To doB. Handling Missing Data:
You already visualized all the columns of this dataset in the previous section. We’re now studying the nature of the missing values.
Compute the percentage of missing values within each column.
Create two lists:
NA_list: a list containing all the names of columns with missing values.NoNA_list: a list containing all the names of columns without missing values.
Show the distribution of each column in
NoNA_list, both before and after removing missing values based onNA_list.Compute the statistical summary of each column in
NoNA_list, both before and after removing missing values based onNA_list.Deduce the nature of the missing values (e.g., MCAR, MAR, or MNAR)?
Can you explain the main reasoning that may lead to this conclusion?
How would you handle this missing values based on your conclusion?
# To doC. Analyzing Connections Between Columns
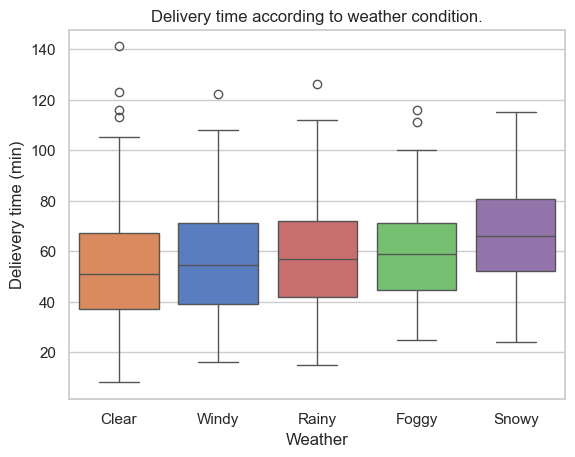
Impact of Weather on Delivery Time: determine if weather conditions affect delivery time.
Influence of Traffic Level: determine whether traffic levels impact delivery time?
Effect of Vehicle Type: How can we evaluate if the type of vehicle used influences delivery time?
Role of Distance: How can we analyze the relationship between distance and delivery time?
Hint: You can extract such a relation by visualizing two variables at the same time. For example, the impact of
WeatheronDelivery Timecan be visualized using graph that describeDelivery Timewithin eachWeathercondition. Conditional Boxplot is a good option for such task (shown below).
Further Reading
Pandaspython library: https://pandas.pydata.org/docs/getting_started/index.html#getting-startedPandas Cheatsheet: https://pandas.pydata.org/Pandas_Cheat_Sheet.pdf10 Minute to Pandas: https://pandas.pydata.org/docs/user_guide/10min.htmlSome Pandas Lession: https://www.kaggle.com/learn/pandas