Review Preprocessing & Data Wrangling


INS-605: Data Analysis

Lecturer: Dr. Sothea HAS

About the course

🎯 Objective:

Equip you with

  • More advanced skills to handle, preprocess and uncover insights from data.
  • Key: Unsupervised Learning and Multivariate Analysis techniques to apply them to solve real-world problems with proper interpretation.

πŸ“ Grading Criteria

Criteria In-class & quiz Lab Midterm Final Project
Percentage 15% 25% 30% 30%

πŸ’» Programming: Python

Jupyter Notebook, Google colab, Matplotlib, Seaborn

Course materials

  • Canvas: INS 605 Data Analysis II.

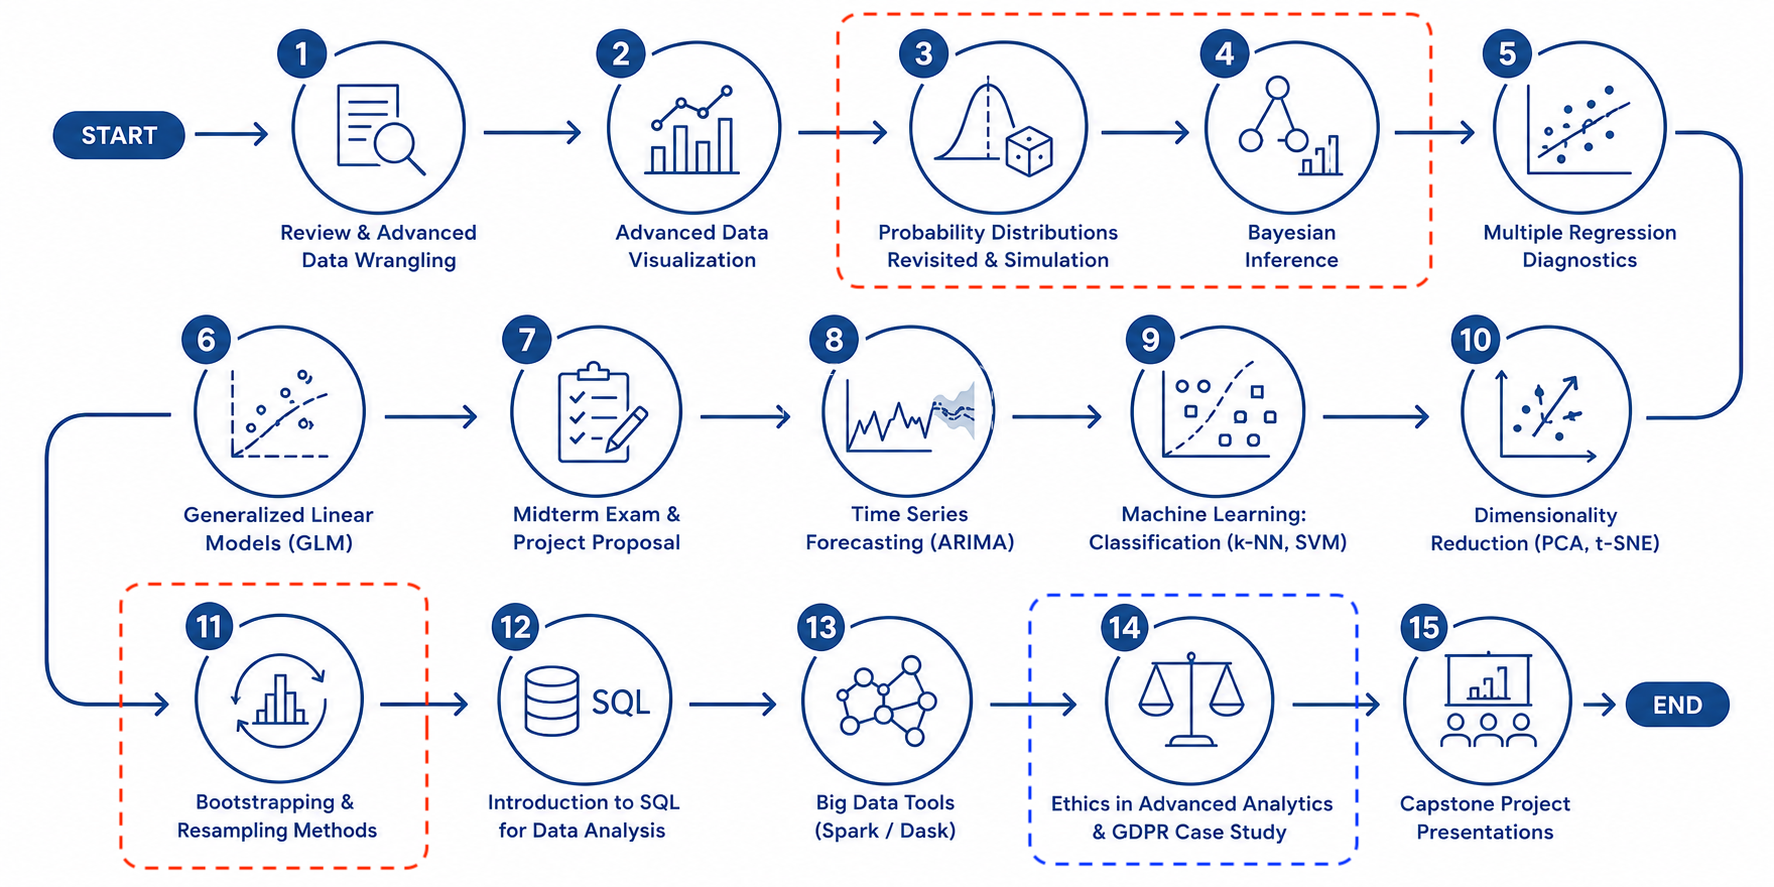
Course roadmap

1 Intro & Motivation

1.1 Introduction

  • Data Wrangling: Process - Messy data \(\to\) Analysis-ready data.
            ONE MESSY DATASET
                    β”‚
                    β–Ό
          "Can we analyze this?"
                    β”‚
       β”Œβ”€β”€β”€β”€β”€β”€β”€β”€β”€β”€β”€β”€β”Όβ”€β”€β”€β”€β”€β”€β”€β”€β”€β”€β”€β”€β”
       β–Ό            β–Ό            β–Ό
     CLEAN      TRANSFORM     COMBINE
       β”‚            β”‚            β”‚
       β””β”€β”€β”€β”€β”€β”€β”€β”€β”€β”€β”€β”€β”Όβ”€β”€β”€β”€β”€β”€β”€β”€β”€β”€β”€β”€β”˜
                    β–Ό
                 RESHAPE
                    β”‚
                    β–Ό
                 VALIDATE
                    β”‚
                    β–Ό
            ANALYSIS-READY DATA
  • Data Analyst’s Role: Convert raw data \(\to\) insights.
  • Problems we aim to solve:
    • Data quality: Timeliness, uniqueness, validity, consistency, accuracy, completeness.
    • Structure: Untidy layouts.
    • Integration: Granularity mismatches.
    • Outliers & noise…

Data Wrangling

  • Bad data often refers to data that are poor in quality or format.
  • Messy data are poor in quality (but not inaccurate nor outdated) or in format.
  • Important Question: For Messy data, can we reliably transform it into a structure suitable for analysis?
  • Data wrangling is the process of making messy data structurally and semantically usable.

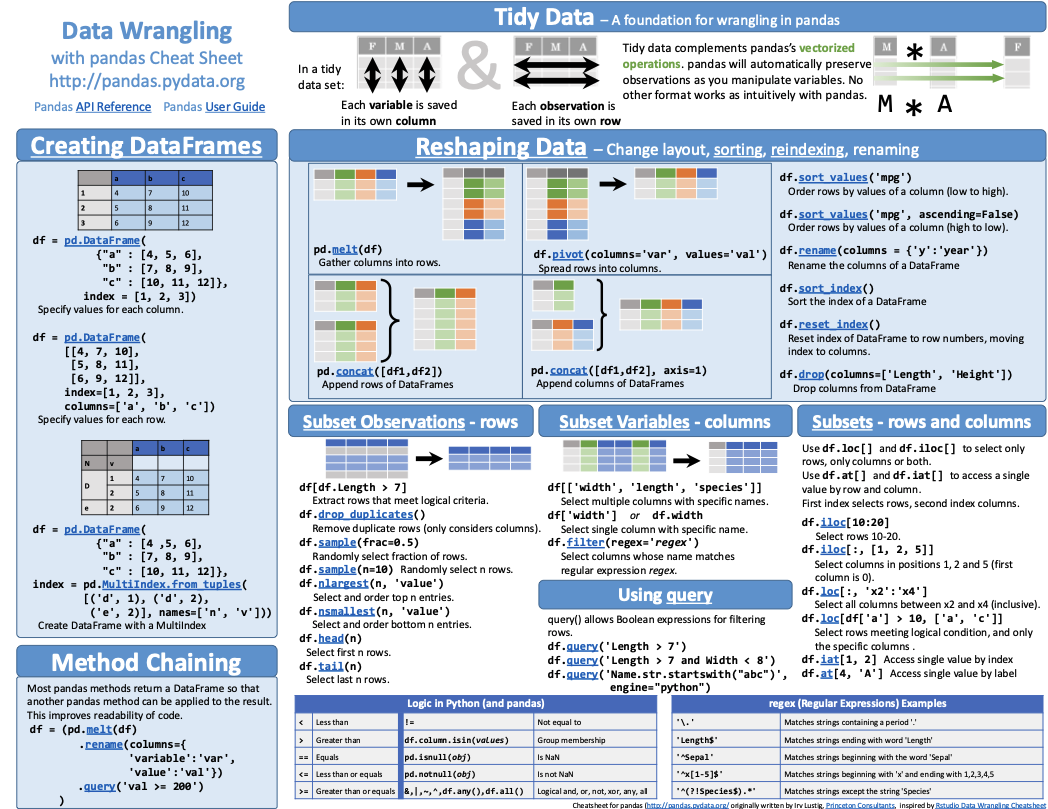
Useful resource

1.2 Motivation

Case study: Amazon product rating

Code
data.loc[[1], 'Rating'] = np.nan
data.loc[data.sample(127, random_state=21).index, 'Rating'] = np.nan
data.head(5)
UserId ProductId ProductType Rating Timestamp URL
0 A3NHUQ33CFH3VM B00LLPT4HI Eyeliner & Kajal 5.0 1405814400 https://www.amazon.in/Maybelline-Colossal-Kaja...
1 A1TIRNQ7O4REOH B00LLPT4HI Eyeliner & Kajal NaN 1405987200 https://www.amazon.in/Maybelline-Colossal-Kaja...
2 A2Y36BR4YSY9F7 B00LLPT4HI Eyeliner & Kajal 5.0 1405728000 https://www.amazon.in/Maybelline-Colossal-Kaja...
3 A23H6FAOLEMAKC B00LLPT4HI Eyeliner & Kajal 5.0 1405814400 https://www.amazon.in/Maybelline-Colossal-Kaja...
4 A3CHYZGF3OO6WD B00LLPT4HI Eyeliner & Kajal 5.0 1405641600 https://www.amazon.in/Maybelline-Colossal-Kaja...
  • Goal: β€œUse this data to boost our platform performance.”
  • Before anything else, the data should be ready for analysis!
  • Q1: What information would be helpful for this goal?

Let’s see πŸ€”

2 Data inspection

2.1 What’s wrong with the data?

Principle: Never start cleaning before understanding the data!

  • If needed, you may encode column names, translate,…, then check:
    • Dimensions
    • Data types
    • Missingness
    • Unique values
    • Suspicious categories
    • Unexpected values
  • Python:
# Check dimension
data.shape

# Data type
data.info()
data.dtypes

# Check NA if already 
# encoded properly
data.isna().sum()

# Check number of 
# dupplications
data.duplicated().sum()

# Check suspicious 
# categories of
# variable 'name'
data["name"].unique()

Amazon data inspection

  • Dimension: (1348246, 6).
  • Data types:
Code
data.dtypes
UserId          object
ProductId       object
ProductType     object
Rating         float64
Timestamp        int64
URL             object
dtype: object
  • Number of categories:
Code
for va in data.columns:
  print(f"{va} : ", int(data[va].nunique()))
UserId :  883753
ProductId :  23838
ProductType :  22
Rating :  5
Timestamp :  3978
URL :  23838
  • Missing values:
Code
data.isna().sum()
UserId           0
ProductId        0
ProductType      0
Rating         128
Timestamp        0
URL              0
dtype: int64
  • Check Rating in detail:
Code
df_temp = data['Rating'].value_counts(normalize=True).to_frame().reset_index(names=['Rating'])
fig = px.bar(df_temp,
          x = 'Rating',
          y = 'proportion')
fig.update_layout(
  width=400, height=120, 
  title='Rating distribution')\
   .show()
  • Number of duplications: 0.

Detected problems

  • What problems did you detect within this data?

Detected problems

  • What problems did you detect within this data?
UserId ProductId ProductType Rating Timestamp URL
0 A3NHUQ33CFH3VM B00LLPT4HI Eyeliner & Kajal 5.0 1405814400 https://www.amazon.in/Maybelline-Colossal-Kaja...
1 A1TIRNQ7O4REOH B00LLPT4HI Eyeliner & Kajal NaN 1405987200 https://www.amazon.in/Maybelline-Colossal-Kaja...
2 A2Y36BR4YSY9F7 B00LLPT4HI Eyeliner & Kajal 5.0 1405728000 https://www.amazon.in/Maybelline-Colossal-Kaja...
3 A23H6FAOLEMAKC B00LLPT4HI Eyeliner & Kajal 5.0 1405814400 https://www.amazon.in/Maybelline-Colossal-Kaja...
4 A3CHYZGF3OO6WD B00LLPT4HI Eyeliner & Kajal 5.0 1405641600 https://www.amazon.in/Maybelline-Colossal-Kaja...
  • Type of Rating type should be int.
  • Timestamp should be in datetime for better analysis.
  • Missing values in the Rating column.
  • Note: ProductID and URL have exact same number of categories, are they related?
  • Let’s handle them!

3 Data Cleaning

3.1 Data cleaning

Handling missing values

  • Recall about missing values
             Missing?
                 β”‚
                 β–Ό
             size/important?
       β”Œβ”€β”€β”€β”€β”€β”€β”€β”€β”€β”΄β”€β”€β”€β”€β”€β”€β”€β”€β”€β”
       β–Ό                   β–Ό
   Important         Not important?
       β”‚                   β”‚
       β–Ό                   β–Ό
Investigate (type)   Remove/retain
       β”‚
       β–Ό
Can we infer it?
   β”‚         β”‚
  Yes        No
   β”‚         β”‚
Impute    Keep NaN
  • Missing proportion: 9.5e-05.
  • Missing data imputation int.
val = float(data['Rating']\
        .mode(dropna=True))
data['Rating'] = data['Rating']\
        .fillna(val)
print(f"Number of NAs: ",
      data['Rating'].isna().sum())
Number of NAs:  0

Understand them before handling them to avoid bias.

Data type & consistency

  • Timestamp to Datetime.
import datetime
data['Timestamp'] = pd.to_datetime(
  data['Timestamp'], 
  unit='s')
data[['Timestamp']].sample(8)
Timestamp
570577 2013-06-15
142069 2013-02-07
591011 2010-06-17
1046007 2013-08-23
246814 2014-06-19
108895 2013-10-14
568552 2013-02-06
333462 2013-06-17
  • Convert Rating type to int.
data['Rating'] = data['Rating']\
  .astype(int)
print(
  "Rating type: ", 
  data['Rating'].dtype)
Rating type:  int64
  • ProductId & URL consistency:
    • Repeated rows in both columns.
    • Compare to a single column.
a = len(data[['ProductId', 'URL']]\
  .drop_duplicates()) # duplicates in both
b = data['URL'].nunique() # count individual
print(f"The two are {'consistent' if a == b\
  else 'not consistent'}.") # consistent equal.
The two are consistent.
  • Challenge: Propose an alternative!

4 Trasformation, Grouping & Aggregation

4.1 Feature Transformation

  • Transformation: Creates new variables from the old ones.
  • Current data:
UserId ProductId ProductType Rating Timestamp URL
0 A3NHUQ33CFH3VM B00LLPT4HI Eyeliner & Kajal 5 2014-07-20 https://www.amazon.in/Maybelline-Colossal-Kaja...
1 A1TIRNQ7O4REOH B00LLPT4HI Eyeliner & Kajal 5 2014-07-22 https://www.amazon.in/Maybelline-Colossal-Kaja...
2 A2Y36BR4YSY9F7 B00LLPT4HI Eyeliner & Kajal 5 2014-07-19 https://www.amazon.in/Maybelline-Colossal-Kaja...
  • Let’s create variable Status by:
    • Status = β€˜High’ if Rating \(\geq 4\).
    • Status = β€˜Medium’ if Rating \(=3\).
    • Status = β€˜Low’ if Rating \(\leq 2\).
  • data.apply(): axis-wise transform.
  • data.transform(): whole col. transform.
Code
data['Status'] = data['Rating'].apply(
  lambda x: 'High' if\
     x>=4 else\
       ('Medium' if\
         x > 2 else 'Low')
)
data[['Status', 'Rating']]\
  .sample(5)
Status Rating
904105 High 5
861833 High 5
992465 High 5
744227 Low 2
737340 Low 2

More transformation

  • Other transformations may also be useful:
Method Operates on Main purpose Output shape Typical use
apply() Rows or columns Apply a custom function to each row/column May change shape Complex row/column logic.
transform() Rows or columns Transform while preserving alignment Same shape Standardization, normalization, group-wise transformations
map() Individual cells Element-wise transformation Same shape Transform every value
pipe() Whole DataFrame/Series Pass object through a function Depends on function Build readable transformation pipelines (e.g. dropna -> drop col)
agg() / aggregate() Rows or columns Compute summaries/statistics Usually reduced mean, sum, min, max, etc.

More transformations

  • Keys: will you operate on and what will you return?
                    What are you operating on?
                              β”‚
          β”Œβ”€β”€β”€β”€β”€β”€β”€β”€β”€β”€β”€β”€β”€β”€β”€β”€β”€β”€β”€β”Όβ”€β”€β”€β”€β”€β”€β”€β”€β”€β”€β”€β”€β”€β”€β”€β”€β”€β”€β”€β”
          β”‚                   β”‚                   β”‚
        CELL              ROW / COLUMN         WHOLE DF
          β”‚                   β”‚                   |
          |                 apply()               |
        map()          β”Œβ”€β”€β”€β”€β”€β”€β”΄β”€β”€β”€β”€β”€β”€β”            β”‚
                       β”‚             β”‚            β”‚
                  same shape?     reduce?      pipe()
                       β”‚             β”‚
                  transform()      agg()   
  • data.map(): I’ll do this action to all the cells.
  • data.pipe(): I’ll do this action to the whole data.
  • data.apply(): I’ll do all these actions to whatever axis I want.
  • data.transform(): I’ll do all these actions along the row/column but outcomes must align with original shape.
  • data.agg(): I’ll summarize my rows or columns and return the reduce summaries.

4.2 Grouping & aggregating

  • data.groupby(): abstractly groups rows by categories of particular columns.
  • Then, any summary functions (e.g. size, mean, max,…) can be applied per group.
  • Ex: Let’s find 5 products with the most purchases.
    • Group by ProductId \(\to\) count purchases \(\to\) sort counts.
data.groupby('ProductId')\
  .size()\
  .sort_values(ascending=False)\
  .to_frame(name='Count')\
  .head(5).T          
ProductId B0009V1YR8 B0043OYFKU B0000YUXI0 B003V265QW B000ZMBSPE
Count 2869 2477 2143 2088 2041
  • What about customers that purchased the most? Likely churn?

5 Combining data

5.2 Merge function

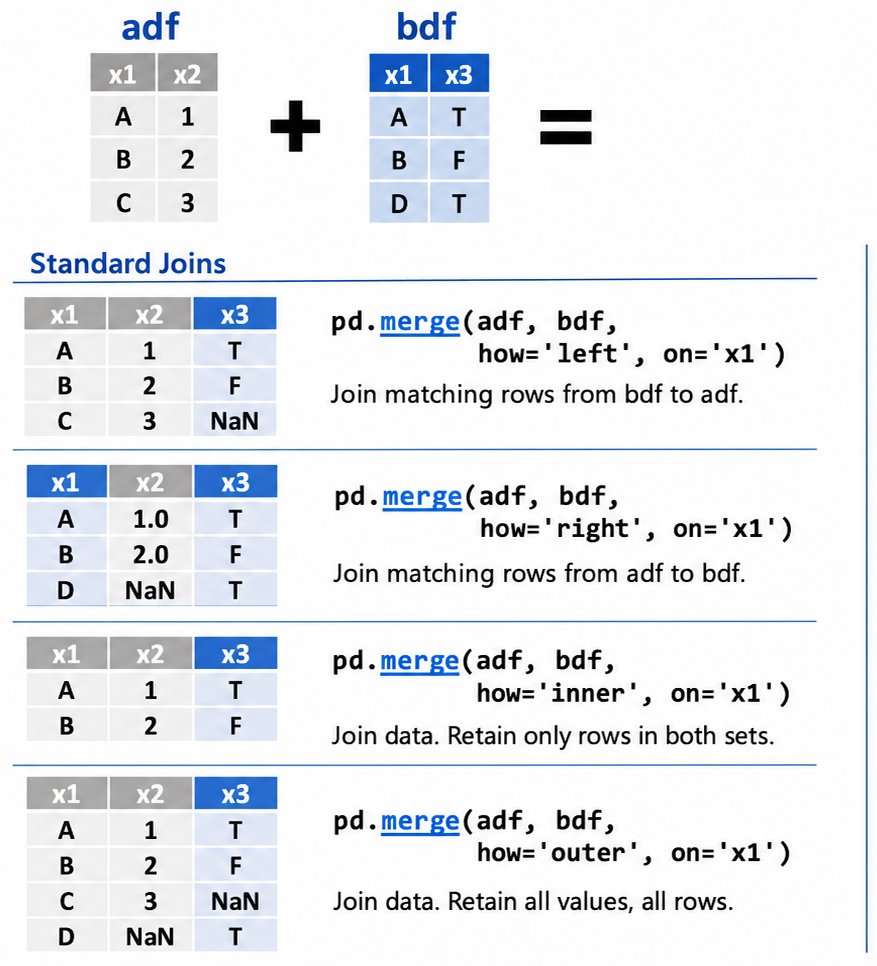
  • To merge two dataframes, pd.merge() is a common choice.

Code
data2.iloc[:3,[1,2,3,8]]
ProductId UserId ProfileName Summary
0 B001E4KFG0 A3SGXH7AUHU8GW delmartian Good Quality Dog Food
1 B00813GRG4 A1D87F6ZCVE5NK dll pa Not as Advertised
2 B000LQOCH0 ABXLMWJIXXAIN Natalia Corres "Natalia Corres" "Delight" says it all
  • Let’s merge it to the previous one:
df = pd.merge(data, data2,
        how='inner',
        on='ProductId')
print(f'Merged data shape : {df.shape}.')
Merged data shape : (448737, 16).

data.join() is another SQL-like function and combines data using indexes.

5.3 Concatenate function

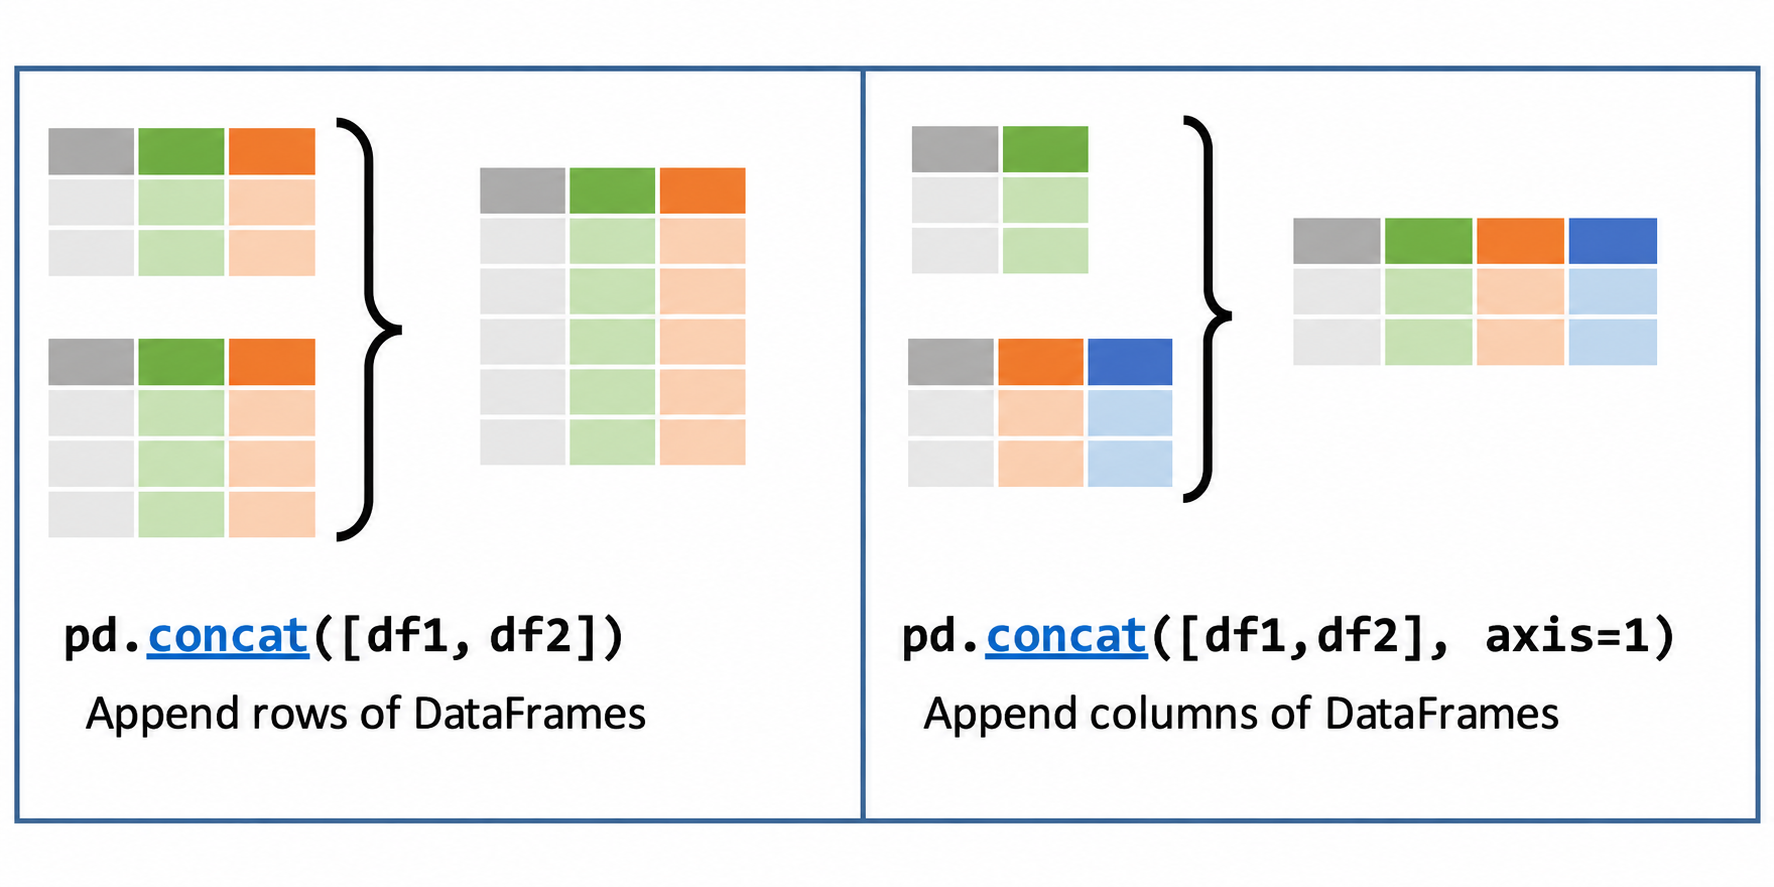
  • pd.concat() is used to glue together two datasets:
    • vertically (axis=0) if their columns are identical
    • horizontally (axis=1) if their rows are identical.

6 Reshaping data

6.1 Melting & Pivoting

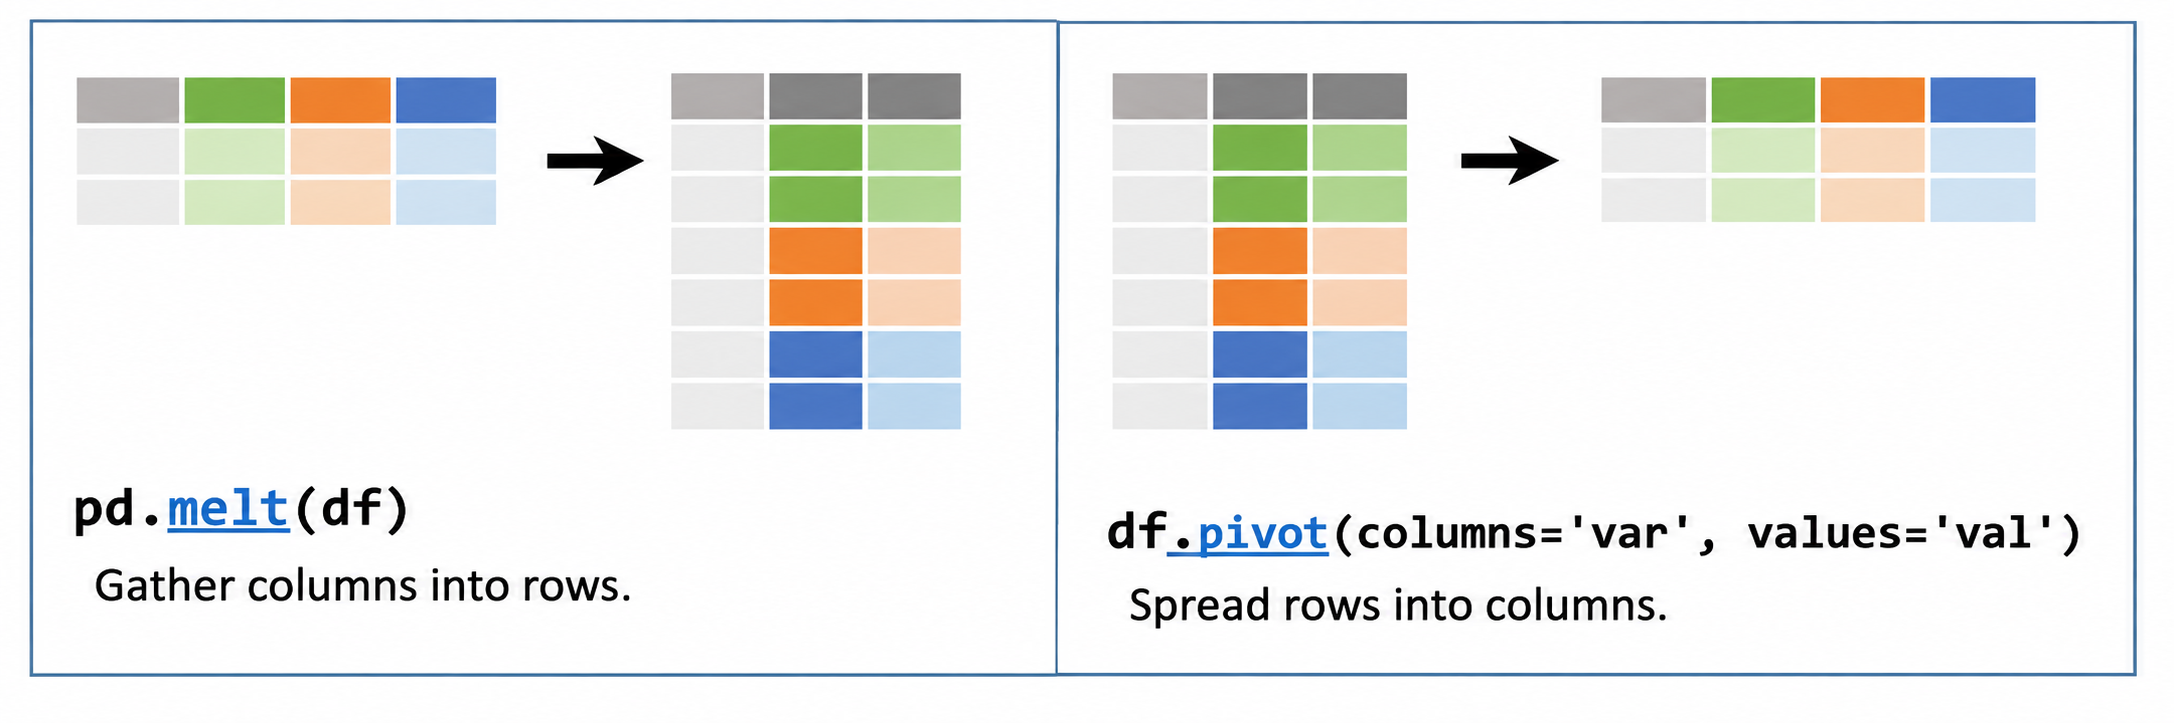
  • pd.melt(): wide \(\to\) long, stack values of all columns vertically to a column value and variable names to another column variable.
  • pd.pivot(): long \(\to\) wide, reverse of pd.melt().

  • Tip: pd.melt() is for graphing & analysis while pd.pivot() is for veiwing/reporting.

7 Validation

7.1 Check what you did

  • Q2: How do we know we did what we intended to do?
  • Validation: verifying everything you have done!
df_merged.shape

df_merged.duplicated().sum()

df_merged.isna().sum()

df_merged.describe()

df_merged['Rating'].value_counts()

df_merged["Rating"].nunique()
  • It’s a good practice to always check each step of your cleaning process.
  • If things are not clear, flag 🚩 the problems and seek help!

7.2 Summary

  • Inspect Before You Act: Never start cleaning without understanding the data first. Always check dimensions, types, missingness, and duplicates.
  • Clean & Transform Strategically: Handle missing values intentionally and choose the right Pandas tool (apply, map, transform, agg) based on the axis and desired output.
  • Combine & Reshape: Use pd.merge() or pd.concat() to integrate datasets, and master melt() (wide \(\to\) long) vs. pivot() (long \(\to\) wide).
  • Always Validate: Continuously verify your work at every step (shape, isna(), describe()) to ensure your code did exactly what you intended.

πŸ₯³ Yeahhhh πŸ₯‚!!!


Any question? Else, we take a break!